TOTAL3 Chart vs Altseason: Key Levels You Must Know
TOTAL3 vs. Altseason: The One Chart That Reveals Everything
While the market is buzzing with speculation about the next altseason, experienced investors know that hope is not a strategy. Instead of guessing, they turn to data. And when it comes to the health of the altcoin market, no chart is more important than TOTAL3 – the total market capitalization of all cryptocurrencies, excluding Bitcoin and Ethereum.
What Exactly is the TOTAL3 Chart?
Simply put, TOTAL3 measures the total value of the entire altcoin market. It strips out the influence of the two giants, BTC and ETH, giving us the purest view of capital flowing into projects like Solana, Cardano, Chainlink, and thousands of others. You can track this chart live on platforms like TradingView. Why is this so crucial? Because a true, sustainable altcoin rally happens only when new money decisively enters this specific segment of the market.
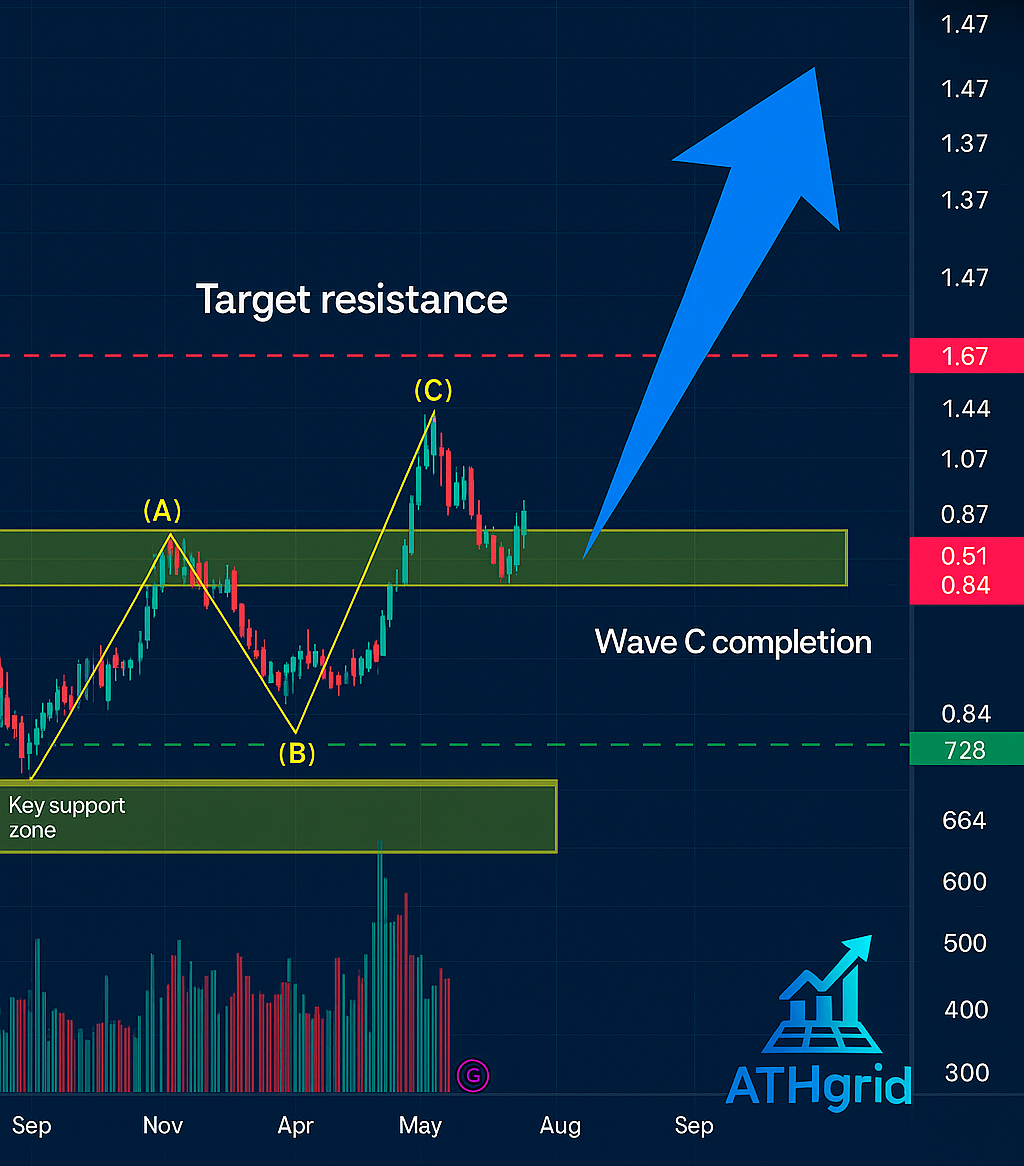
Short-Term Analysis: The ABCs of a Potential Breakout
Looking at the recent price action on the TOTAL3 chart, we can see a classic ABC corrective pattern has formed. After completing Wave C, the price has now pulled back to a critical support zone – the area of the previous peak of Wave A. Holding this level is the first condition for the market to do “something more than just a 3-wave move.”
The key hurdle to overcome is the recent high at $1.13 trillion. A decisive break above this level would be a powerful bullish signal, giving altcoins a real chance to build upward momentum.
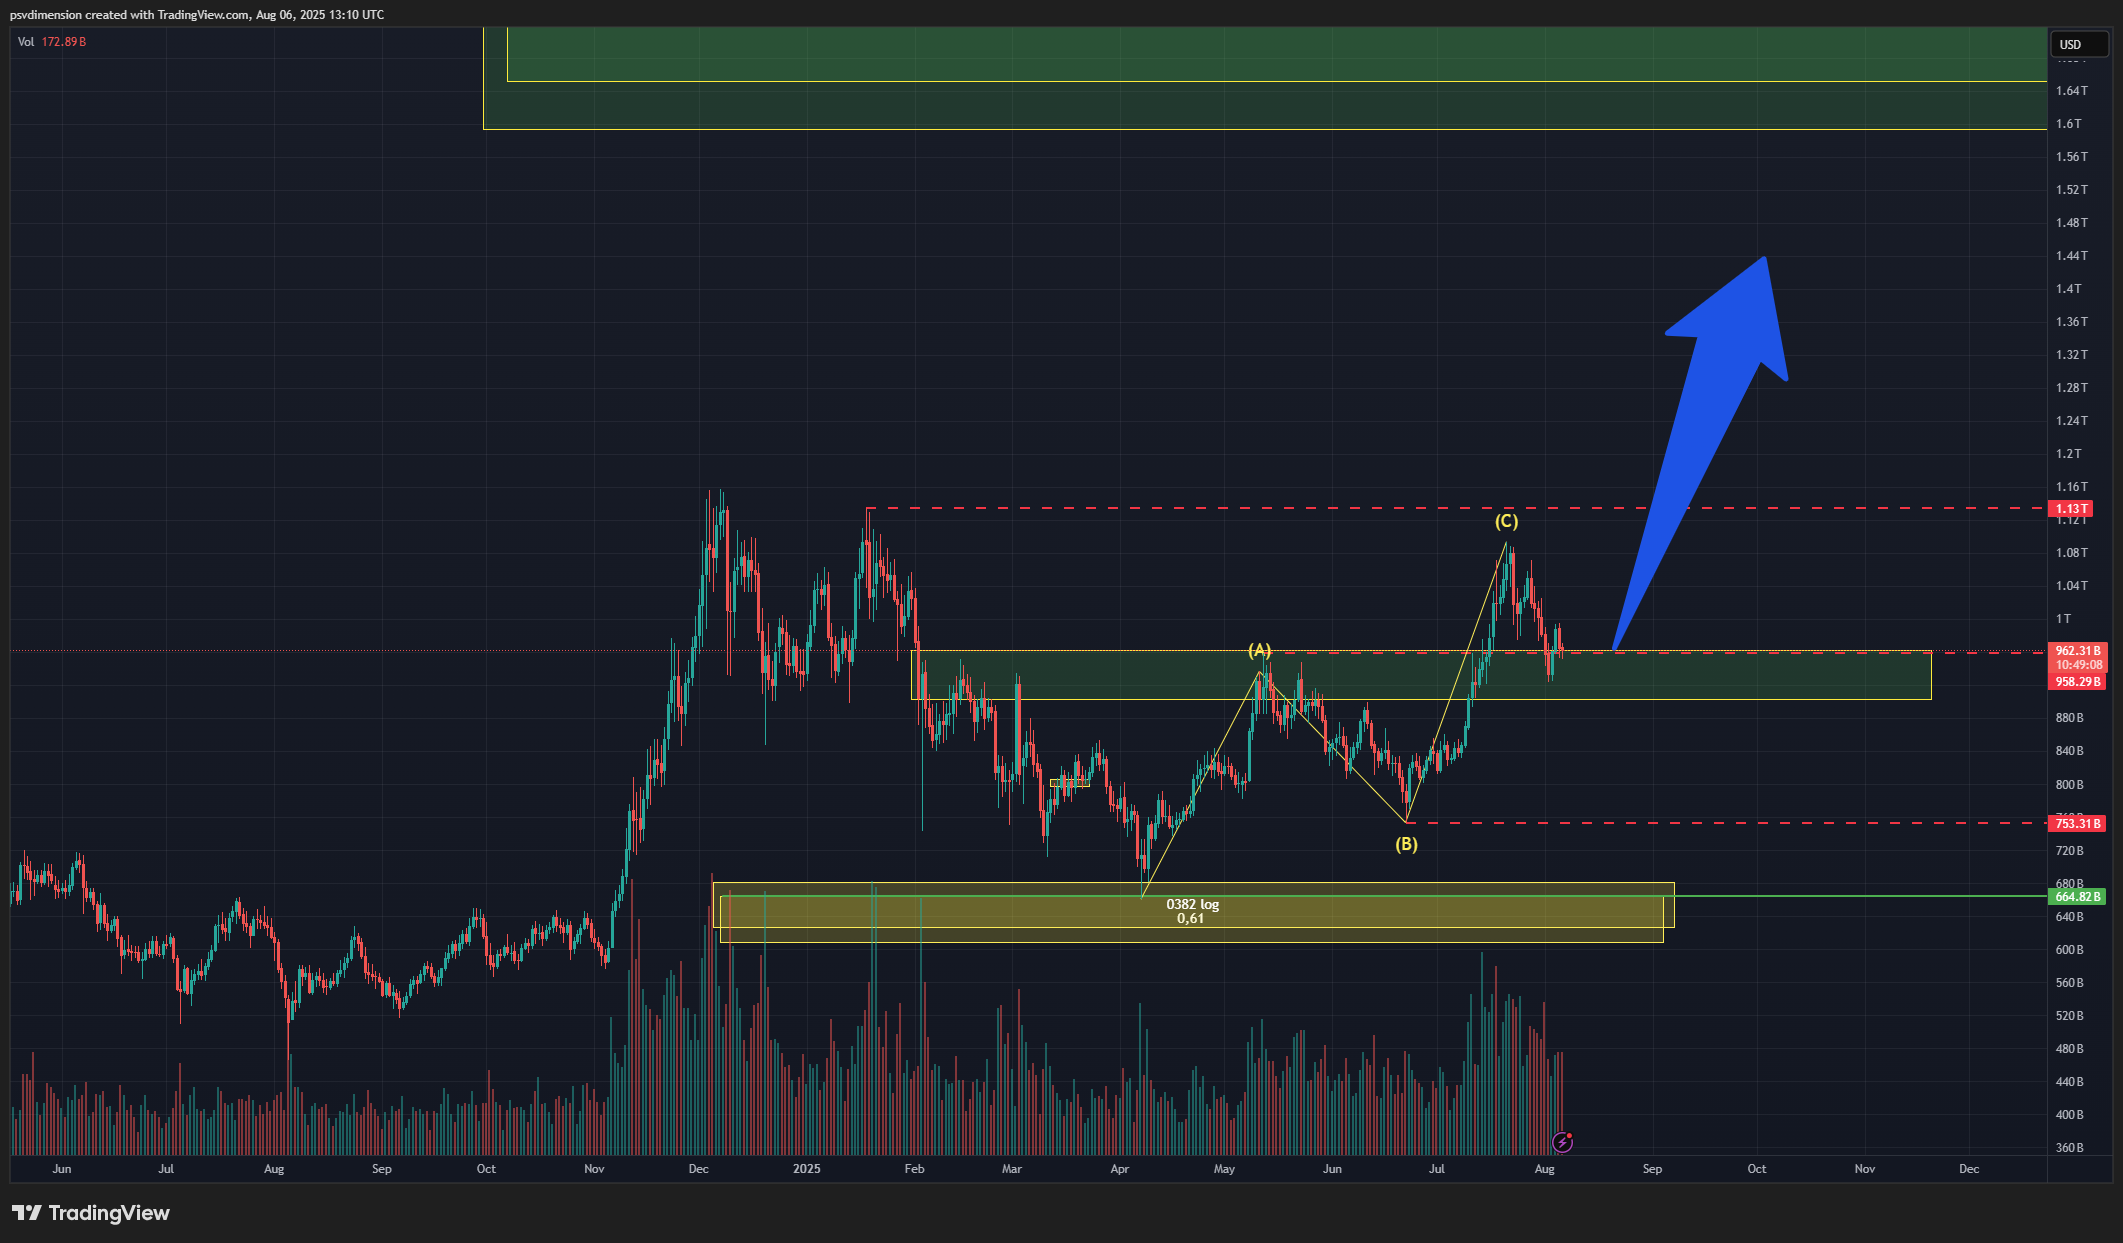
However, the most critical level to watch on the downside is the low of Wave B at $753.31 billion. A break below this support would invalidate the immediate bullish structure and signal further weakness.
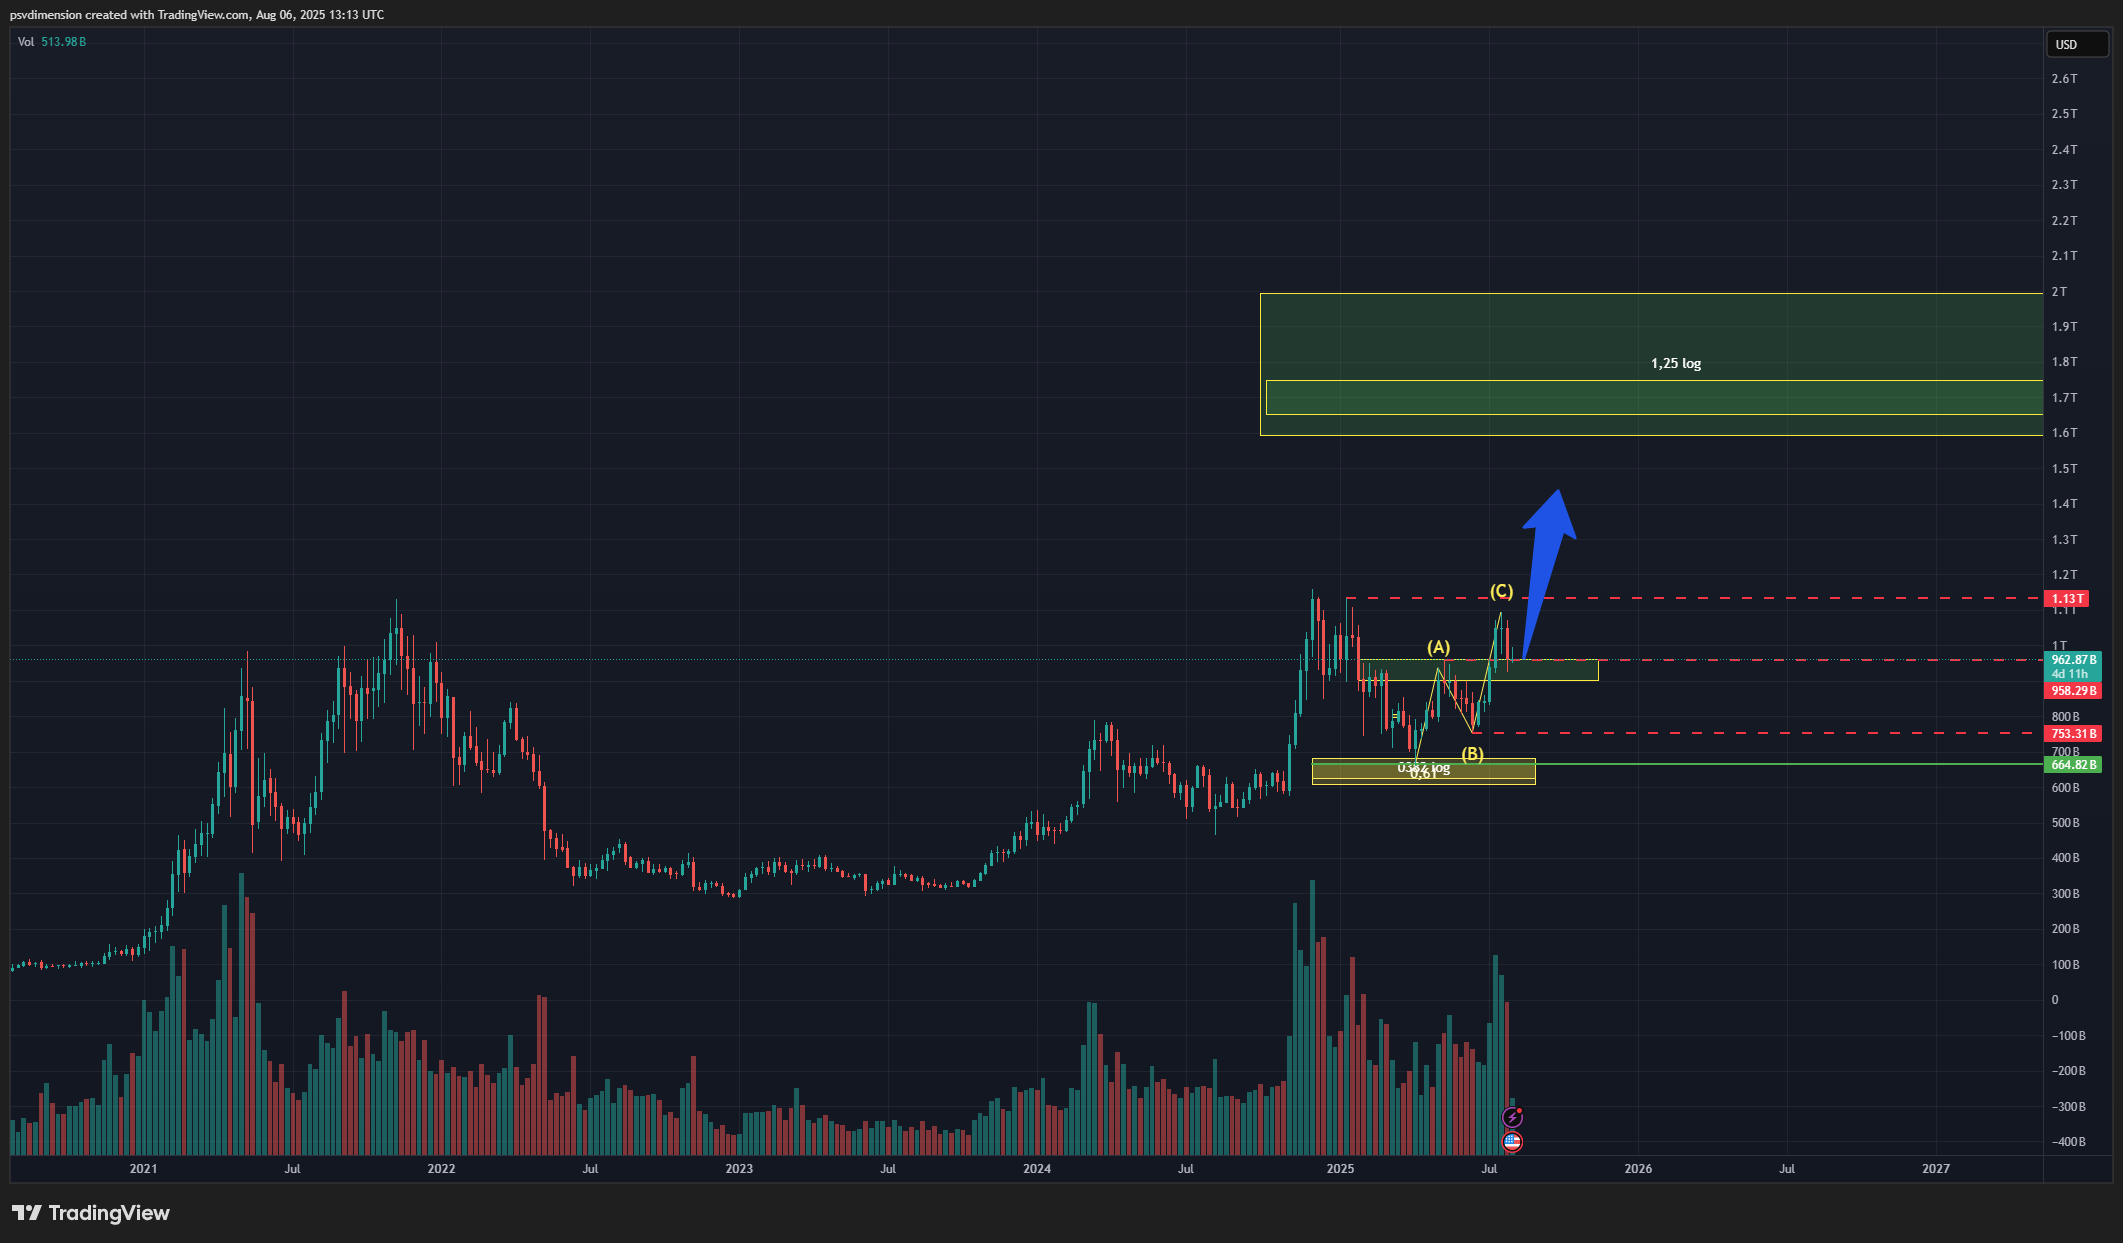
The Bigger Picture: A Realistic Target for Altseason
If the market successfully breaks the $1.13T resistance, where could we be headed? Looking at the long-term chart, the next major target is the resistance zone around $1.6 trillion. This isn’t a random number; this level corresponds to the 1.25 logarithmic scale measurement from the last historical market bottom.
Reaching this zone would represent a massive “breather” for altcoins, likely fueling a widespread rally and bringing significant relief to investors who have patiently waited.
Strategy Over Stress: How to Navigate the Uncertainty
So, we have a clear map: a support to hold, a resistance to break, and a target to aim for. But the outcome remains uncertain. This uncertainty is what causes stress, sleepless nights, and emotional decisions for most traders.
What if you could participate in the market’s volatility without having to guess the direction correctly? This is where a systematic, automated strategy like Grid Trading shines. A tool like ATHgrid allows you to set up a trading bot that automatically buys low and sells high within a range you define. It doesn’t care if TOTAL3 is going to $1.6T tomorrow or retesting support first. It simply trades the chaos, accumulating profits from every price swing.
It’s a strategy that allows you to live peacefully and sleep soundly, knowing your trading plan is being executed 24/7 without your emotional input.
Ready to replace hope with a system? Download ATHgrid and discover how automated trading can handle the market chaos for you.
Leave a Reply