Will BTC Cycle History Repeat? Logarithmic Analysis Points to a $175,000 Target
BTC Cycle Analysis
The cryptocurrency market, particularly Bitcoin, has fascinated traders for years with its cyclical nature. Although history never repeats itself exactly, it often rhymes, leaving patterns on the charts that can help navigate future price movements. By analyzing the current bull cycle on a logarithmic scale and comparing it to the previous one from 2020-2021, we uncover striking similarities that may point to a potential peak for this bull run around the $175,000 mark.
Echoes of the Past: The 2021 Bull Run and BTC Cycle
Let’s look at the chart on TradingView.
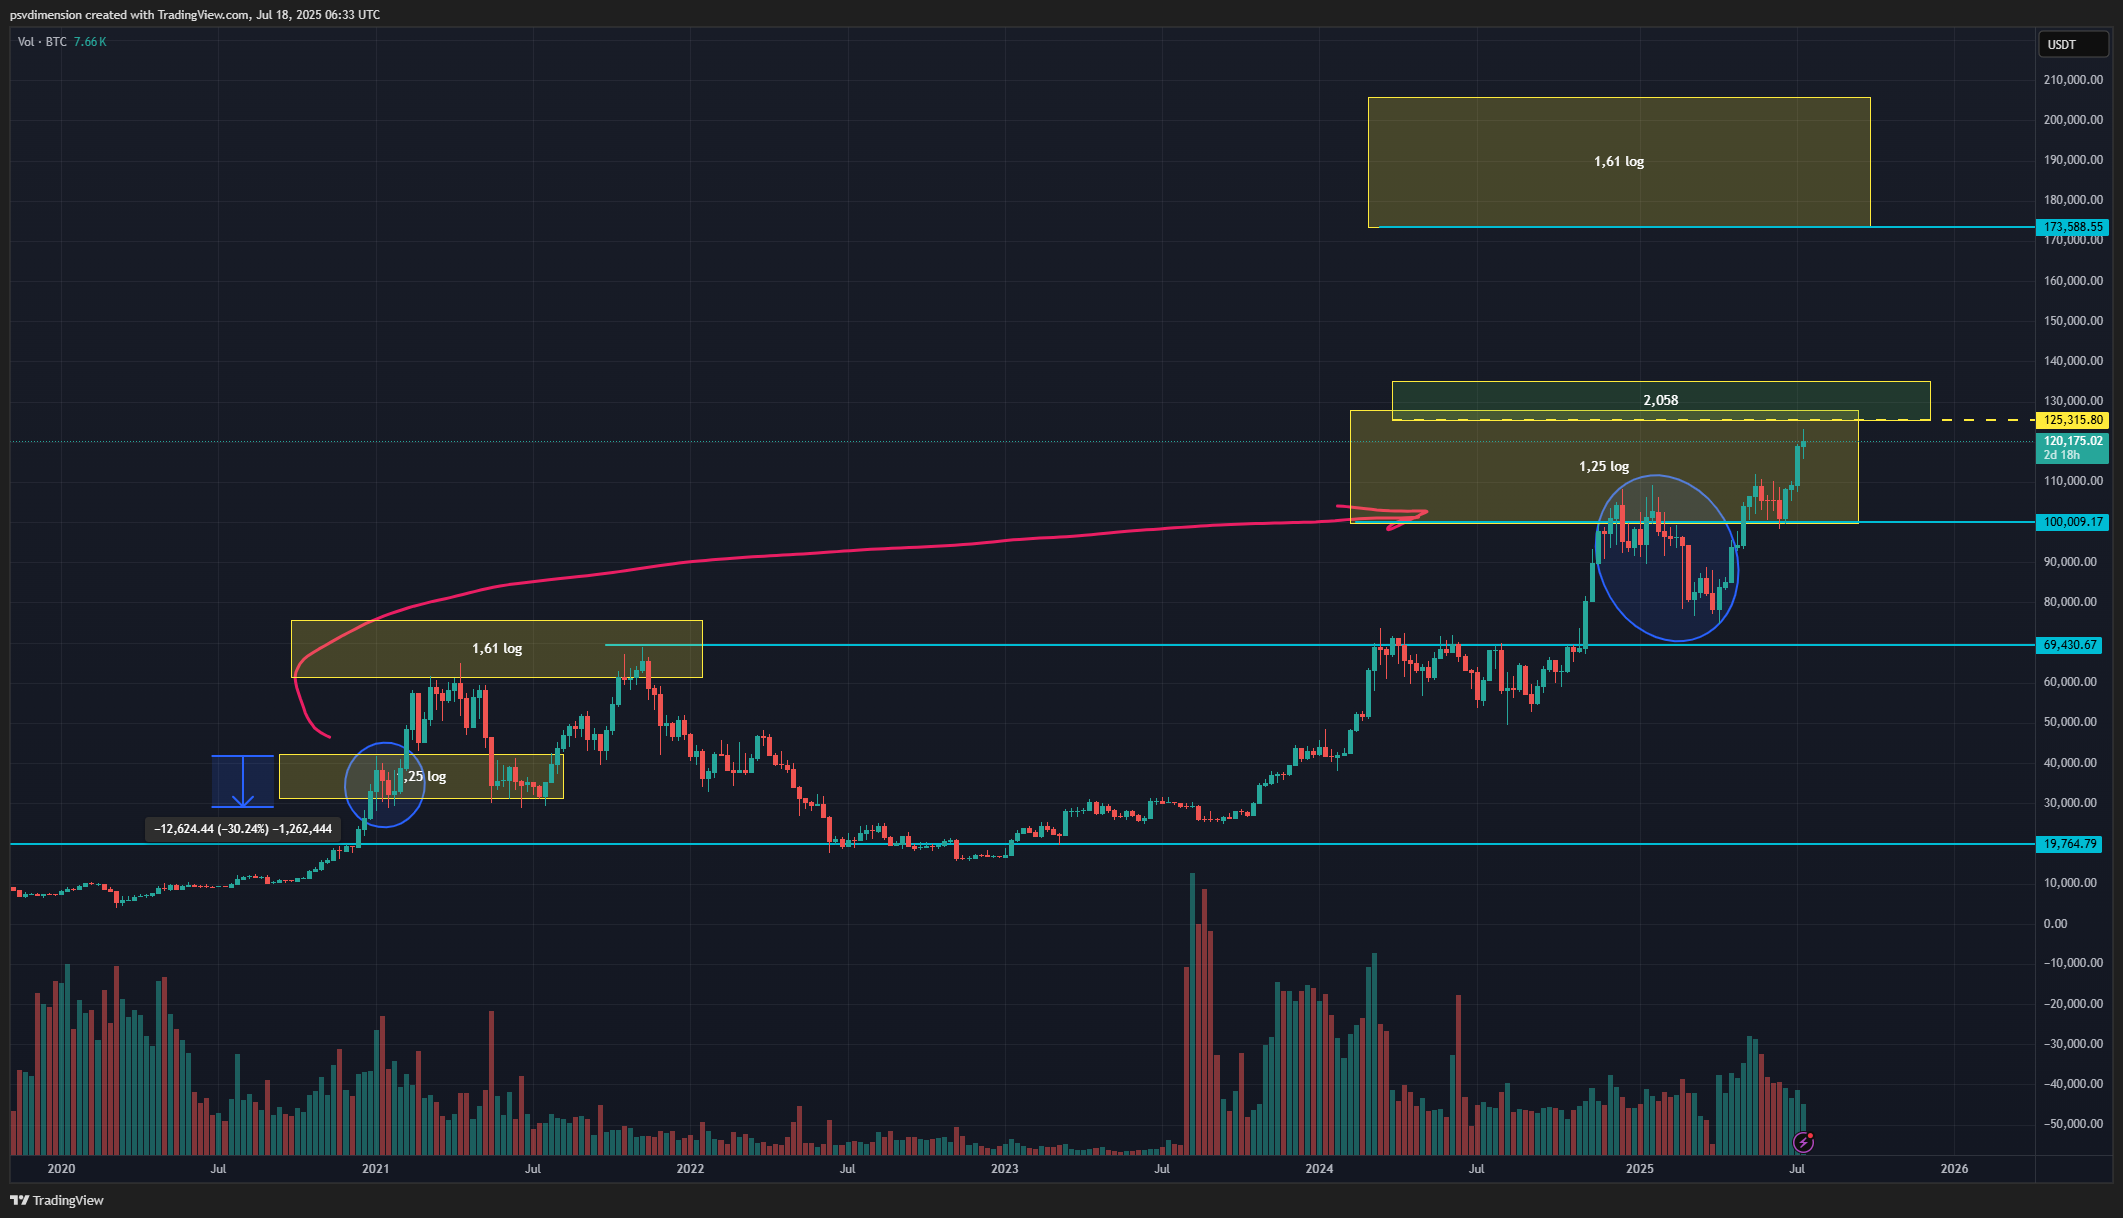
In the previous cycle, after a dynamic surge, Bitcoin caught its breath and entered a consolidation phase. A key pause occurred at the 1.25 logarithmic Fibonacci extension level. This was a period where the market tested investors’ patience before making its final push upward. The peak of the bull run and the end of the cycle occurred at the next key level – 1.61 log. After reaching this target, a long bear market began.
The Current Cycle: Are We Playing the Same Script?
Let’s shift to the present. As seen in the blue circle on the chart, we have witnessed nearly identical behavior this year. The price of Bitcoin, after an impressive rally, has once again paused and consolidated around the 1.25 log level. This similarity is too clear to ignore and forms the basis of our further analysis.
What’s Next? Two Key Levels on the Horizon
If history is to repeat itself, we have two crucial stops ahead:
1. The Supply Zone (~$128,000): Before we think about the peak, BTC must overcome a significant resistance zone. On our chart, this is marked by the 2.058 Fibo level, corresponding to a price of approximately $128,000. This is an area where sellers have historically been strong, so breaking through this level will be a key confirmation of the bulls’ strength.
2. The Potential Cycle Top (~$175,000): If the resistance at $128k is broken, the next logical target, according to the historical pattern, is the 1.61 log level. In the current cycle, this falls at a price of approximately $175,000. This is the level that could represent the potential peak of the current bull run, after which the market may enter a longer correction phase.
How to Use This Knowledge? The Role of Automation in Consolidation
Many traders, seeing such analyses, wait for “that one big move.” However, the real art is to also make money during periods of waiting. Long consolidation phases, like the one we witnessed at the 1.25 log level, are the perfect environment for grid trading strategies. If you’re new to this concept, you can learn the fundamentals in our Ultimate Guide to Grid Trading.
Bots like ATHgrid are designed precisely to systematically accumulate small profits from “boring” sideways price fluctuations. Instead of passively waiting for a breakout, a bot can actively work, generating profits that, over the scale of months, become a significant addition to a portfolio.
Conclusion
Technical analysis based on historical cycles is a powerful tool, but it never offers 100% certainty. The key levels to watch are the resistance at ~$128,000 and the potential target at ~$175,000. Understanding these zones allows for better strategy planning, regardless of whether the market follows this exact path.
A systematic approach, like grid trading, can help you capitalize on the volatility around these key price zones without relying on emotional guesswork.
(Remember, this article is not investment advice. Always conduct your own analysis.)
Ready to put these strategies into action without being glued to a screen? Download ATHgrid today and start automating your trading on Binance!
Leave a Reply