0

ATHGrid 2.0: The New Era of Grid Trading.

A promotional image showing the ATHgrid trading bot with a '7 Days Free' trial offer.

ATHGrid 2.0: The New Era of Grid Trading. Test Risk-Free for 7 Days!

At ATHGrid, we always strive for perfection by listening closely to our community’s needs. We are proud to announce the launch of ATHGrid 2.0, which introduces not only a completely refreshed User Interface (UI) but, most importantly, unlocks a new era of accessibility: Cloud Trading, available on any platform with a browser! Effective immediately, every new user can take advantage of our official 7-Day Free Trial, which includes full access to both the Desktop and Cloud versions.

What’s New in ATHGrid 2.0: Cloud and New UI?

ATHGrid 2.0 has been fundamentally redesigned to ensure intuitive operation and access to your strategies from anywhere in the world. The most important new features are:

  • Cloud Version (24/7): No more hardware limitations. Launch your bot in our cloud and manage it remotely, using any browser on your desktop, tablet, or smartphone. See what your new account panel looks like.
  • Modern User Interface (UI): A brand-new and clear interface (visible in the screenshots) that makes configuration, grid monitoring, and real-time results analysis easier than ever.
  • Free Testnet (No Risk): Full bot configuration and strategy testing are now available on Binance Testnet! You can safely experiment with virtual capital before risking real funds.

Our 7-day trial provides full access to all features, including the Cloud version. Simply register and check the power of automated trading without commitment.

Start your 7-day free trial now!

New User Panel and Cloud Bot Management

The central point of ATHGrid 2.0 is the refreshed My Account panel. This is where you can manage your Cloud bot remotely. No downloading, installing, or keeping your computer on 24/7 is required. Just log in, and from the panel, you can:

  • View the bot server status (e.g., Bot Server Running – ACTIVE).
  • Start, stop, or restart the server bot with a single click.
  • Get a results summary: total profits (TAKEN PROFITS), number of active bots, and total P&L (TOTAL P&L).

Clicking the Open Control Panel button will take you directly to the advanced bot interface, which is key for configuration and testing.

Screenshot showing the new ATHGrid 'MY ACCOUNT' panel with Cloud bot management.

Remote Cloud bot management from the ‘MY ACCOUNT’ panel.

Secure Strategy Testing on Binance Testnet

The new bot interface (UI) gives you complete control over your configuration. The most significant feature for new users is the ability to test every function on the Binance Testnet platform, which operates using virtual capital and real market data. This allows you to:

  • Configure full grids (Grid Levels).
  • Monitor Active Orders and Filled Positions.
  • Track Transaction History and System Logs.

This is your playground for safely refining your Grid Trading strategies before transitioning to trading with real capital. Full instructions for configuring the Testnet API are available in our Guide API Keys Setup at the top of the bot panel.

Screenshot of the new ATHGrid 2.0 bot interface showing full configuration on the Binance Testnet platform.

The new bot interface offers full control and the ability to trade on Testnet (No Risk).

Summary: Your 7 Days to Risk-Free Profit

The launch of ATHGrid 2.0 is the perfect time to join the automation of trading. Thanks to Cloud access and Testnet capabilities, you can: Trade from any location, on any platform, and completely risk-free for a full 7 days. The future of Grid Trading is here.

Ready to take control of the market with ATHGrid 2.0? Start Your Free 7-Day ATHGrid Trial Today!

AGT$: The Official ATHgrid Token

AGT$ token logo against a price chart background in 2025

AGT$: The Official ATHgrid Token in 2025 – A Guide

Every innovative project in the world of cryptocurrency needs a heart—a mechanism that drives its growth, unites its community, and symbolizes its mission. For ATHgrid, that heart is AGT$. This isn’t just another ordinary token. AGT$ is a memecoin with a mission, created to represent our technology, inspire our community, and open the door to exclusive benefits within the automated trading ecosystem. Launched just a few days ago, it’s already generating significant interest. What awaits AGT$ holders in 2025, and why is it worth becoming part of this revolution today? This guide will answer all your questions and show you how AGT$ is defining the future of grid trading. Get ready for an in-depth analysis of a token that aims to be more than just a speculative asset—it aims to be the key to the next generation of trading.

What Is AGT$?

AGT$ is the official token of the ATHgrid project, created on the fast and efficient Solana blockchain. It was born from the energy and culture of memecoins, but its purpose is much deeper: it serves as a digital ambassador for our grid trading bot, building a bridge between advanced technology and an engaged community. Its primary role is to promote and represent the ATHgrid project, giving users a tangible stake in our success. AGT$ was designed as a limited-supply token, which underscores its long-term value.

Here are the key token details:

  • Total Supply: 1,000,000 AGT$
  • Blockchain: Solana (SOL)
  • Launch Date: October 4, 2025

Although AGT$ started with meme characteristics, its roadmap includes the gradual introduction of real utility. Holding AGT$ is already a ticket to being part of something bigger. In the future, the token can be used to obtain discounts on ATHgrid bot licenses and may even be integrated into our trial system. It’s a token that grows with the project—from a meme to an essential tool in the arsenal of every trader using ATHgrid.

See AGT$ on pump.fun and join the community!

Benefits of Holding AGT$

Holding AGT$ tokens is more than just an investment—it’s a membership in an exclusive club within the ATHgrid ecosystem. We have designed a range of benefits that make being part of our community both exciting and rewarding. Here’s what you gain by holding AGT$:

  • Attractive License Discounts: Holders of a specific number of AGT$ tokens will be eligible for significant discounts when purchasing or renewing licenses for the ATHgrid bot. This is a direct way to lower your costs and maximize your trading profits.
  • Early Access to Beta Versions: Want to be the first to test new features, strategies, and improvements in our bot? AGT$ holders will receive priority access to closed beta tests, giving you an edge over the rest of the market.
  • Participation in Governance: Our vision is decentralization. In the future, we plan to introduce governance mechanisms that will allow AGT$ holders to vote on key decisions regarding the project’s development—from new features to marketing directions.

By supporting grid trading, AGT$ creates a closed-loop ecosystem where the token’s value is directly linked to the success and popularity of the ATHgrid bot. The more people use our tool, the greater the potential of AGT$.

Get your AGT$ and unlock exclusive benefits!

How to Buy AGT$? A Step-by-Step Guide

Purchasing AGT$ tokens is simple, even if you’re new to decentralized finance (DeFi) on Solana. Below is a guide that will walk you through the entire process.

  1. Step 1: Get SOL (Solana): AGT$ is a token on the Solana blockchain, so the first step is to acquire the SOL cryptocurrency. You can do this on any major centralized exchange like Binance, Coinbase, or KuCoin.
  2. Step 2: Set Up a Decentralized Wallet: Transfer your purchased SOL to your private wallet that supports the Solana network. The most popular options are Phantom or Solflare, available as browser extensions or mobile apps.
  3. Step 3: Swap SOL for AGT$ on a DEX: Visit a decentralized exchange (DEX) like Raydium or Jupiter (jup.ag). In the swap panel, select SOL as the currency you want to sell. In the field for the currency you want to buy, paste the AGT$ contract address to find it:

EQfuKwohaFkMnmPYK3DdRXi1amSbqStzXg1vEizBpump

After pasting the address, select the amount of SOL to swap, approve the transaction in your wallet, and you’re done—the AGT$ tokens will appear in your wallet!

Buy AGT$ safely on Jupiter DEX!

The Future of AGT$ in ATHgrid

AGT$ is just the beginning of our journey in building an integrated ecosystem. For 2025 and beyond, we have ambitious plans that will further increase the token’s utility and value. One of the key elements of our roadmap is the introduction of AGT$ staking, which will allow holders to earn passive income for supporting the project. We are also working on integrating the token with more trading pairs and features within the ATHgrid bot itself.

Our goal is to build a strong, engaged community that will have a real impact on the project’s development. AGT$ is the tool that will enable us to do this. Join us today and become part of a future where technology and community go hand in hand to create the best tools for automated trading.

Follow our development and join the discussion on X (Twitter)!


Invest in the future of grid trading! Buy AGT$ and test the ATHgrid bot for free!

Automate Your Trading: Try the ATHgrid Bot Free for 7 Days!

A promotional image showing the ATHgrid trading bot with a '7 Days Free' trial offer.

Automate Your Trading: Try the ATHgrid Grid trading Bot Free for 7 Days!

At ATHgrid, our community is our biggest asset, and we always listen to your feedback. A recurring question has been about the opportunity to test our powerful grid trading bot before committing to a subscription. We’re thrilled to announce that, starting today, this is now a reality. We are launching an official 7-Day Free Trial for every new user. This is your chance to experience firsthand how ATHgrid transforms market chaos into consistent, automated profits—completely risk-free.

What’s Included in Your Grid Trading bot Free Trial?

Our 7-day trial is designed to provide a comprehensive experience of our grid trading program’s capabilities without any strings attached. We believe in the power of our software, and we want you to see its value in a live market environment. Here’s what you get:

  • Full-Featured Access for 7 Days: You get one week to deploy and test all the core functionalities of the ATHgrid bot on a trading pair of your choice.
  • No Credit Card Required: Sign up and get started without entering any payment details. We want you to evaluate our tool with complete peace of mind.
  • Instant Key Activation: After entering your email on our website, you will receive a unique license key. You can use this key to activate the full trial period in the application, which is available for download after registration.

The trial’s goal is simple: to demonstrate how straightforward and effective automated trading can be. Once your trial ends, you’ll have a clear understanding of how ATHgrid can enhance your strategy. If you choose to continue, our basic plan is available for just $9.99 a month.

Start your 7-day free trial now!

Why Grid Trading Thrives in Today’s Market

For many manual traders, a sideways market is a source of frustration, offering little opportunity for strong, directional trades. For grid trading bots, however, this is the perfect playground. Instead of waiting for a breakout, a grid bot systematically “farms” profit from every price fluctuation within the established range.

A prime example of this is the current price action on the $ONDO/USDT pair. As the chart below illustrates, $ONDO has been trading within a wide consolidation zone for months. For the ATHgrid bot, every dip toward the lower boundary is an automated buy order, and every rally toward the upper boundary is an automated sell order, capturing profit around the clock. This is precisely the type of market condition where our software excels.


Chart of ONDO/USDT showing a long-term sideways consolidation range, an ideal environment for a grid trading bot strategy.

The long-term sideways range on $ONDO is a perfect environment for the ATHgrid bot.

For up-to-the-minute market analysis and to see the opportunities I’m tracking, you can follow my official X (Twitter) profile ATHgrid.

Get Started in 3 Simple Steps

Activating your free trial is incredibly easy and takes just a few minutes. No advanced technical knowledge is required. Follow these steps to begin:

  1. Get Your Free Trial Key: Visit the free trial section on our website, enter your email address, and click “Get Trial”. We will immediately send your unique 7-day license key to your inbox.
  2. Download the Application: After requesting your key, register or log in to your ATHgrid account to access the download section and get the application.
  3. Activate and Start Trading: Launch the ATHgrid application and paste the key you received via email to unlock full access for seven days. You’re all set!

Summary: Your No-Risk Entry into Automated Trading

The new 7-Day Free Trial is the perfect opportunity to see the power of automated grid trading for yourself. Without any commitment or financial risk, you can test every core feature of ATHgrid in live market conditions and discover how to turn market volatility into a consistent source of profit.

Ready to turn market volatility into automated profit? Start Your Free 7-Day ATHgrid Trial Today!
Crypto Volatility: How to Measure and Use a Trader’s Best Friend

A crypto trader surfing on a wave of a candlestick chart's market volatility.

Market Volatility: A Trader’s Best Friend. How to Measure and Use It?

Ask any novice trader what they fear most in the market, and you’ll likely hear one word: volatility. Violent price swings, unpredictable moves, chaos – it’s all terrifying. But what if I told you that for a conscious investor, especially a Grid Trading bot user, volatility isn’t the enemy? It’s the best friend. It’s the fuel that powers the profit-generating machine.

What Exactly is Market Volatility?

In the simplest terms, volatility is a measure of how much and how quickly the price of a given asset changes over time. High volatility means large and rapid fluctuations in both directions. Low volatility means periods of calm where the price moves within a narrow range. Directional traders hate volatility without a clear trend. Grid traders live for it.

How to Measure Market Volatility? (A Trader’s Weather Forecast)

You don’t have to guess volatility – you can measure it. Think of it as a weather forecast for the market. Two simple tools available on any charting platform like TradingView will help you assess it:

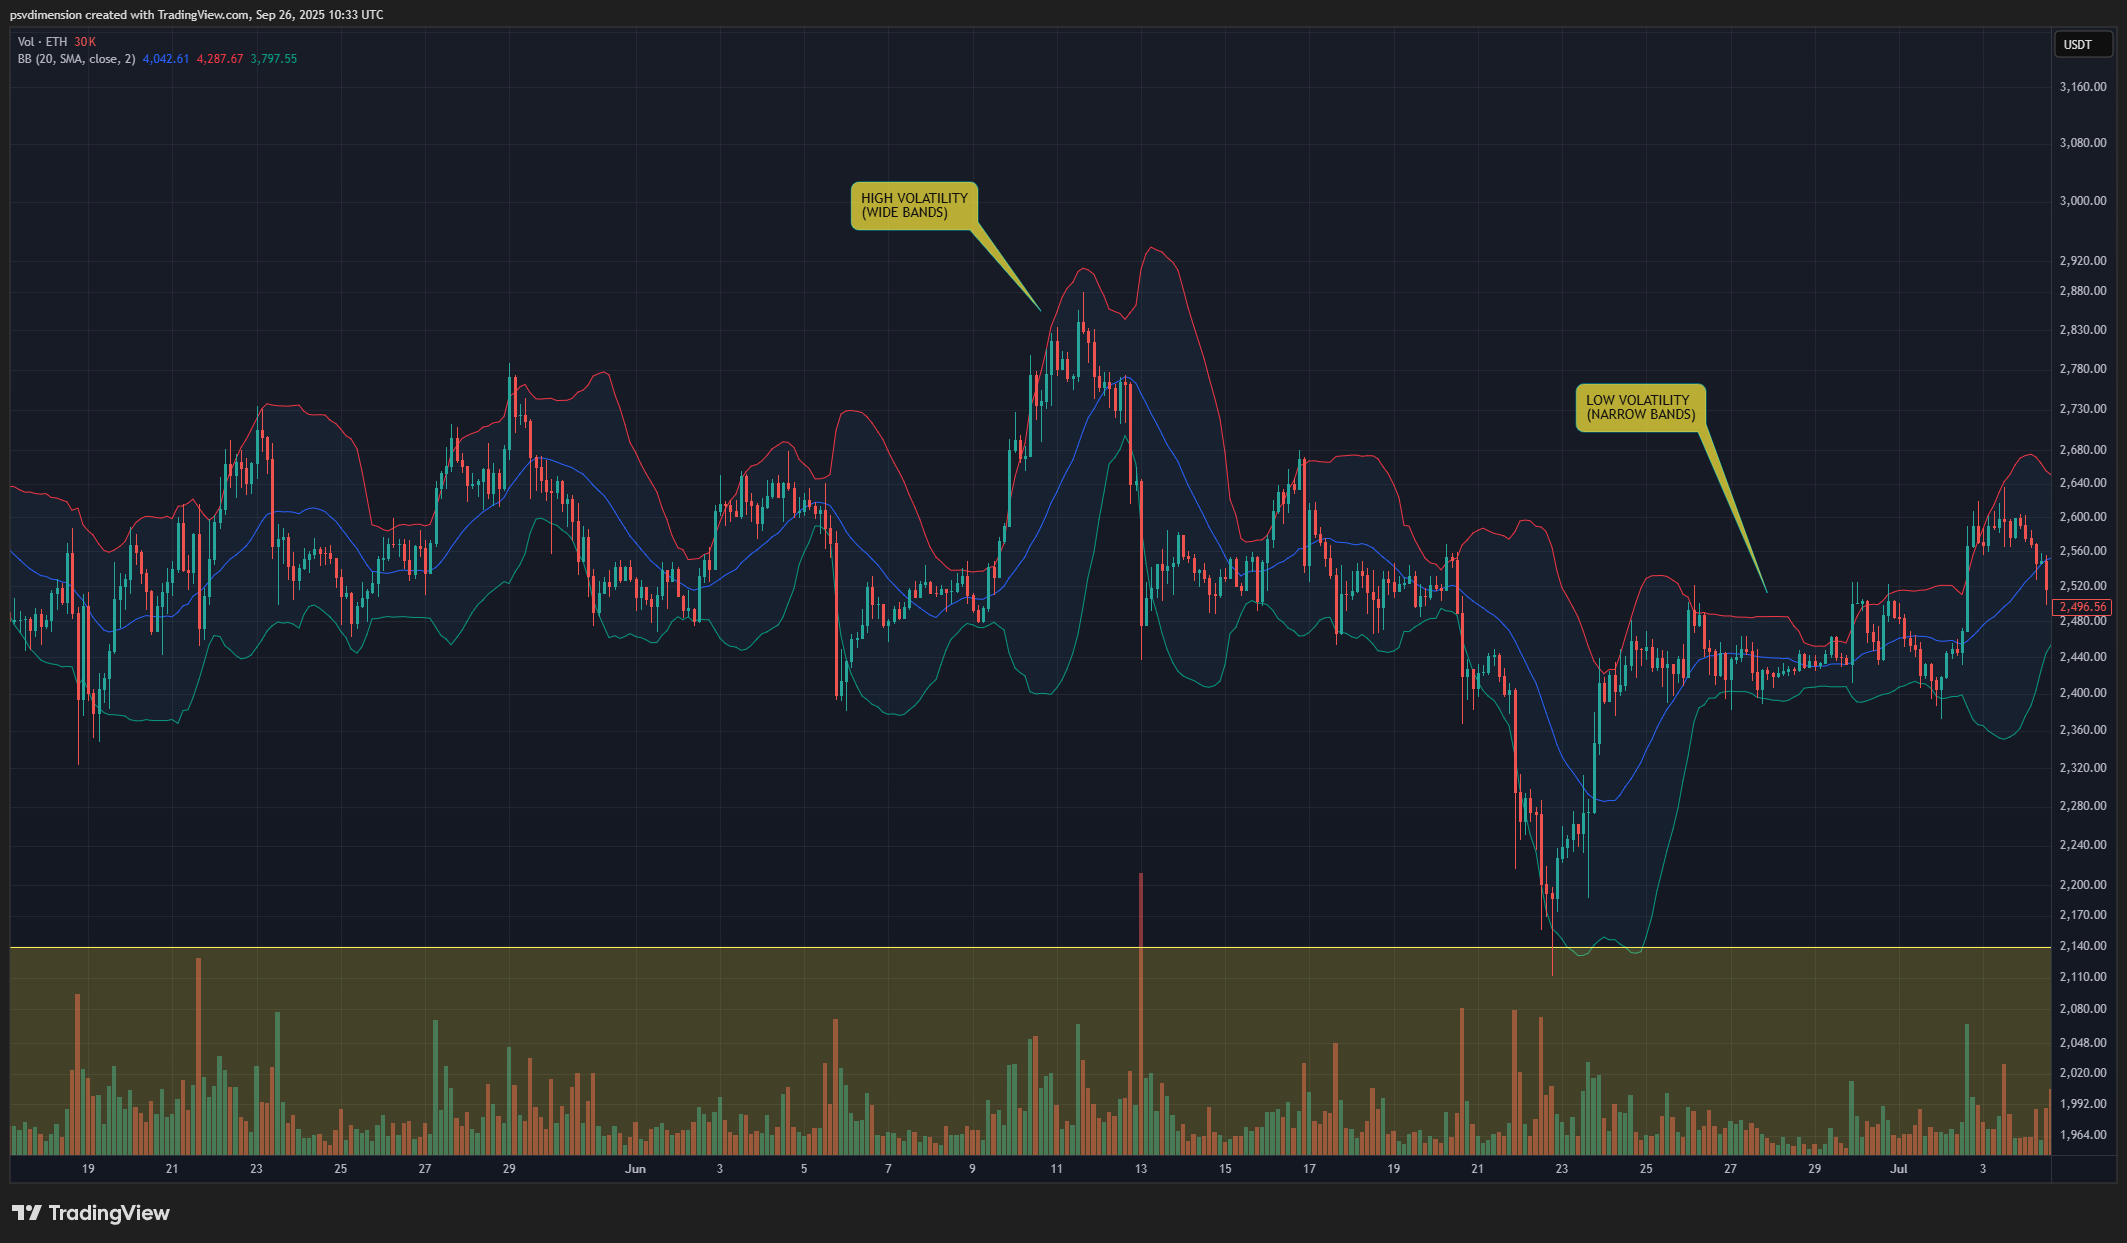
1. Bollinger Bands: This is one of the most popular indicators. You don’t need to understand the complex formulas. Just remember one rule: the width of the bands shows the volatility. When the bands expand, volatility increases. When they contract, the market is entering a period of calm. You can learn more about Bollinger Bands here.


Infographic showing Bollinger Bands on a cryptocurrency chart

Wide bands = high volatility. Narrow bands = low volatility.

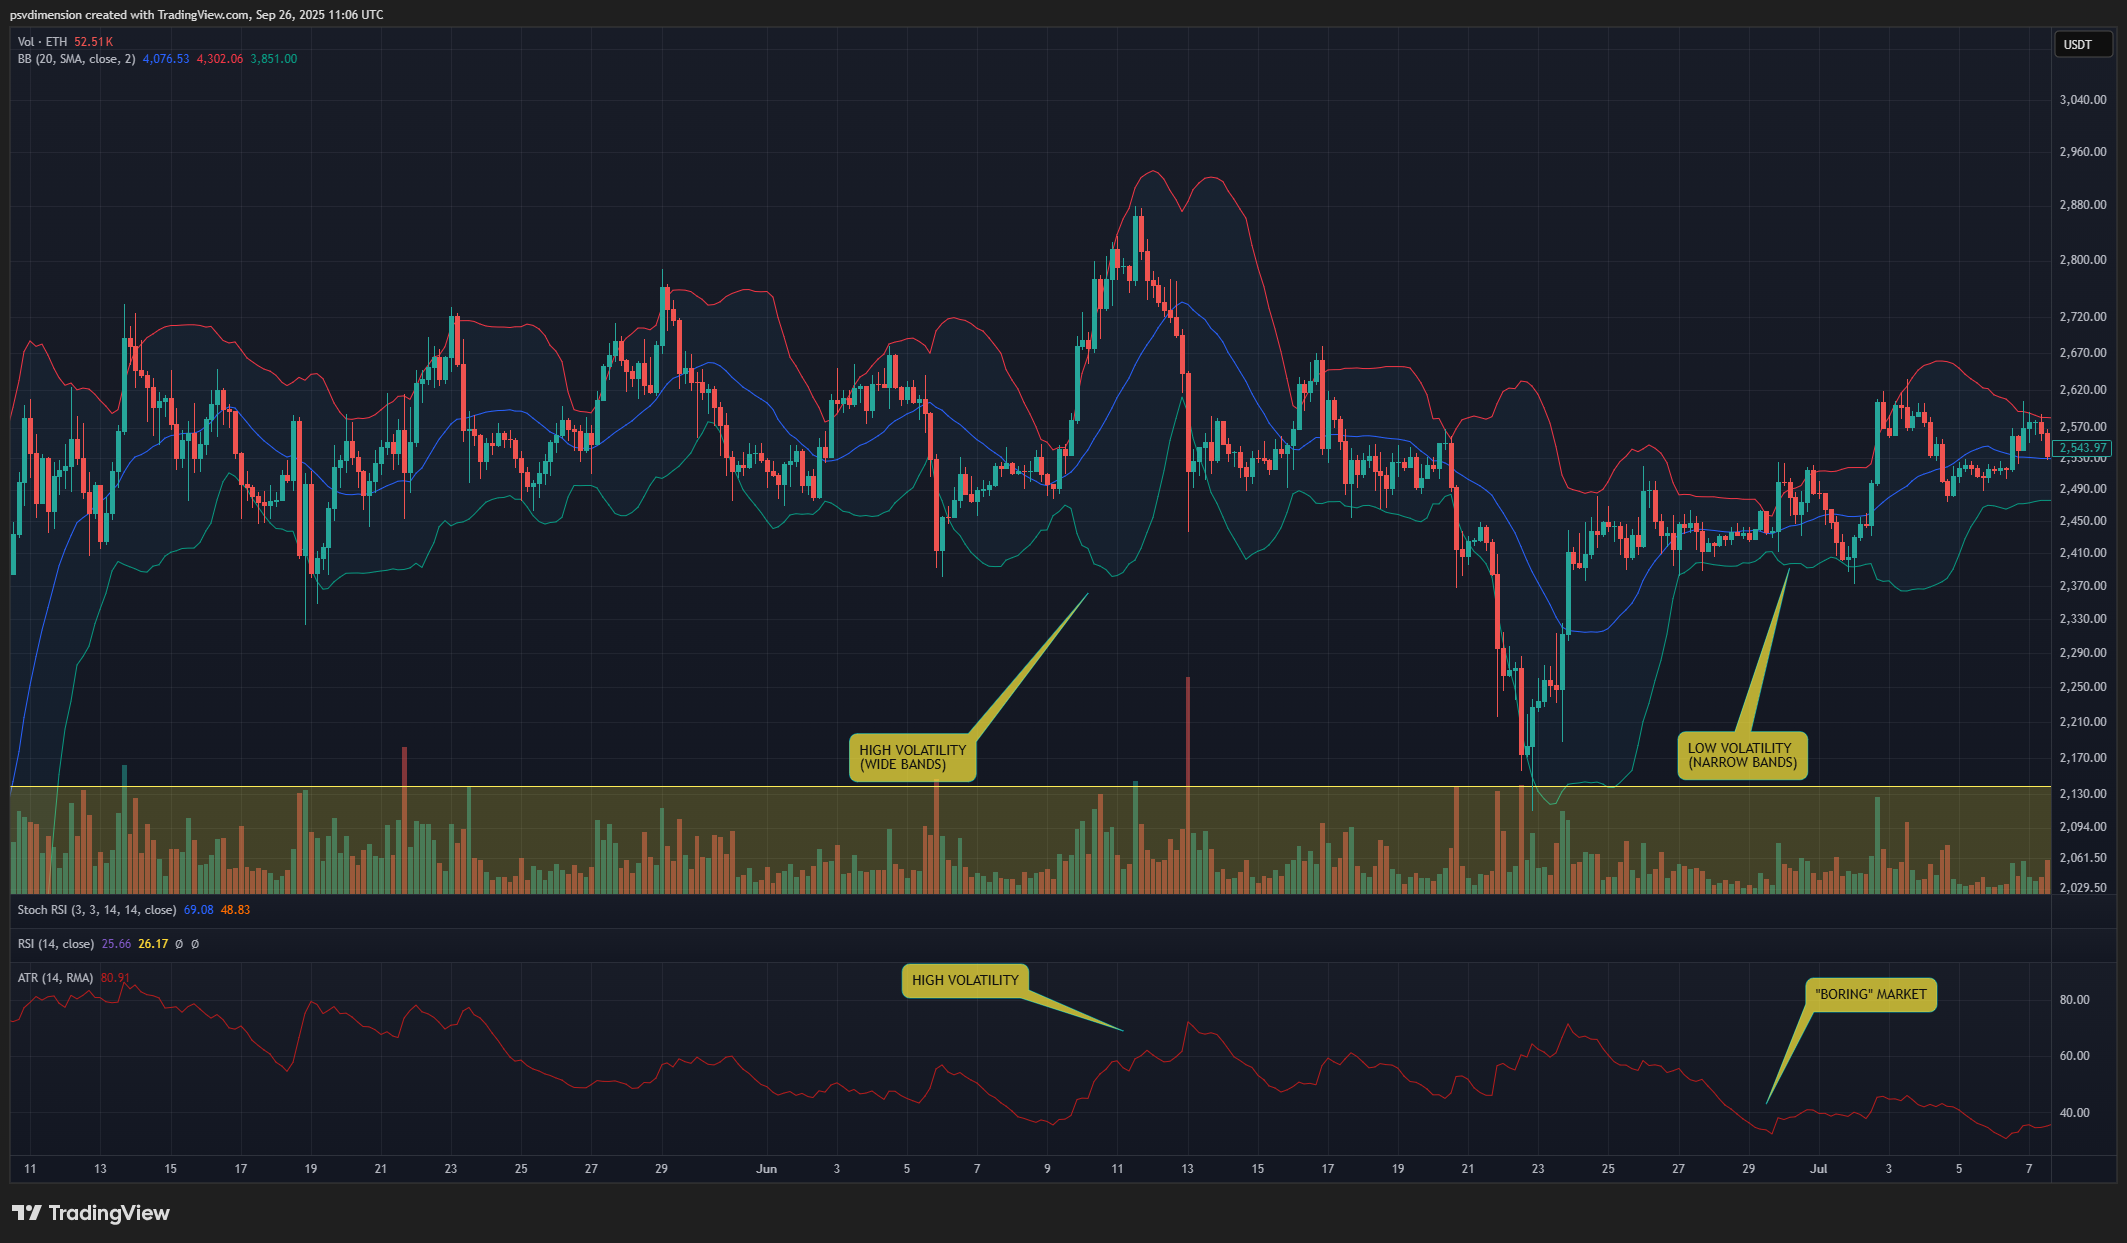
2. ATR (Average True Range): This is an indicator that shows the average range of price movement over a given period. A high ATR value means the candles are large and volatility is high. A low ATR value indicates a “boring” market.


Infographic showing ATR indicator on a cryptocurrency chart

High ATR – Volatility is high. A low ATR – “boring” market.

How to Turn Volatility into Profit with ATHgrid?

With knowledge of the current volatility, you can perfectly adjust your bot’s strategy in ATHgrid:

  • When volatility is HIGH (wide Bollinger Bands, high ATR): Set a wider grid range with fewer levels. This will allow you to catch the larger price swings. This is also the perfect time to use the new “Skip-Level” feature in ATHgrid 1.2 to maximize profit from each strong impulse.
  • When volatility is LOW (narrow Bollinger Bands, low ATR): Set a narrower grid range with more levels (a denser grid). This allows the bot to “farm” even the smallest, most frequent price moves, generating a steady stream of small profits.

Summary: Market Volatility is Your Fuel

Stop seeing volatility as a threat. Start treating it as the free energy that drives the market. Your only job is to have a tool that can efficiently convert that energy into real profits. ATHgrid was created for this very purpose.

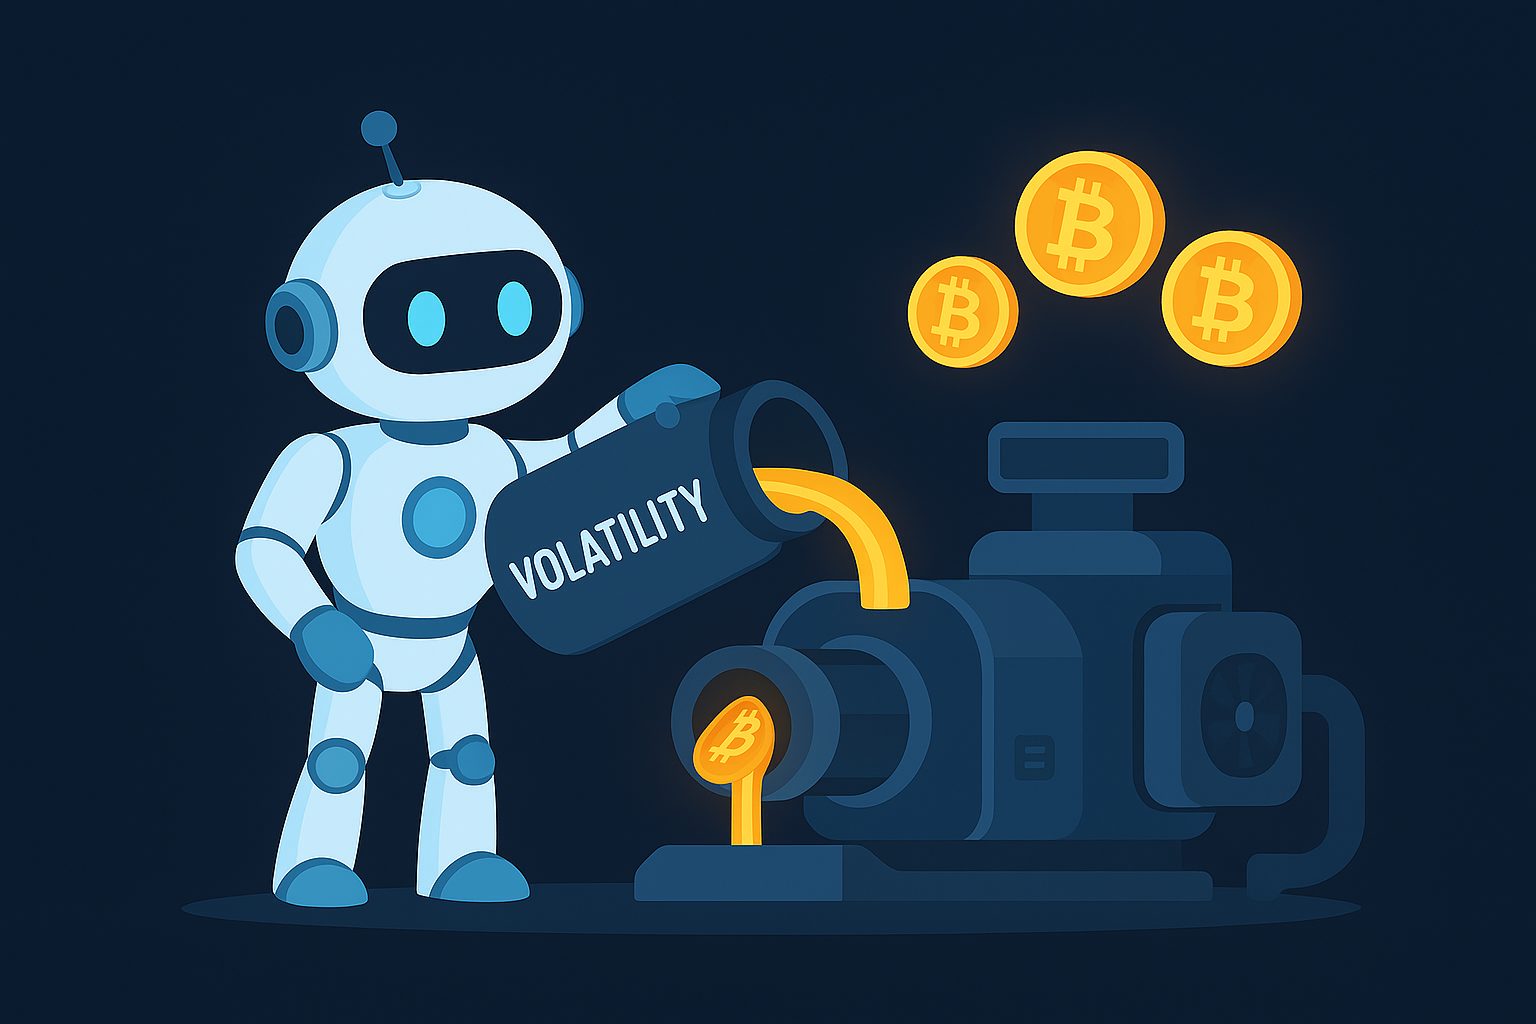
The ATHgrid robot pouring Volatility as fuel into a machine that generates Bitcoins.

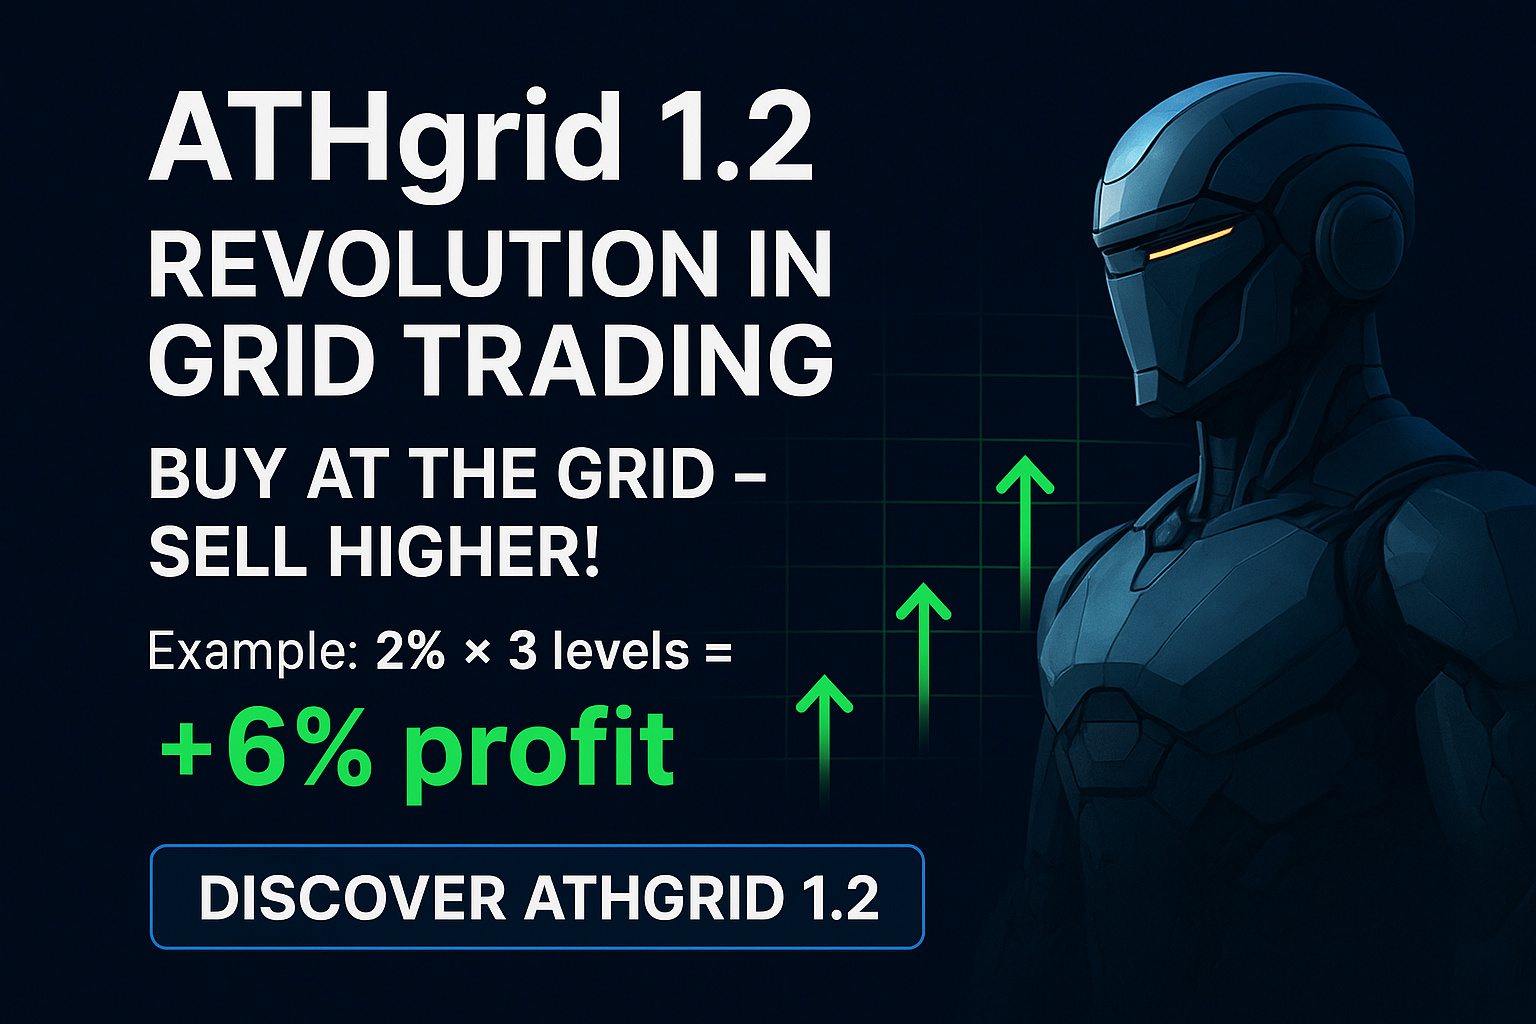
ATHgrid 1.2 – A revolution in Grid Trading with skip-level selling

ATHgrid 1.2 - A revolution in Grid Trading with skip-level selling.

Introducing ATHgrid 1.2: A Revolution in Grid Trading

For years, Grid Trading has been a reliable strategy for profiting from market volatility. The principle is simple: buy low, sell high, over and over. But what if you could make every sell significantly more profitable? What if you could capture bigger moves without sacrificing the systematic nature of the grid? Today, we are excited to announce a feature that fundamentally changes the game: welcome to ATHgrid 1.2 and the “Skip-Level” revolution.

The “Skip-Level” Feature: Buy at the Grid, Sell Higher!

Standard grid bots are effective but have one limitation: they typically sell at the very next grid line up, capturing the smallest possible profit in the system. ATHgrid 1.2 shatters this limitation. With our new “Skip-Level” functionality, you are in complete control of your profit targets.

You can now configure the bot to sell your position 2, 3, 4, or even more grid levels higher than your buy order.

Imagine a grid with 2% spacing between levels. Instead of settling for a ~2% profit, you can instruct the bot to hold the position for 3 levels and sell for a +6% profit. The bot continues to accumulate assets at every level on the way down, but on the way up, it aims for much more significant gains. This combines the automated, stress-free accumulation of grid trading with the higher profit potential of swing trading.

See It in Action: A Real-World Example

Theory is great, but proof is better. The chart below shows the “Skip-Level” feature working on the ETC/USDT pair. The bot was configured to buy at each level but sell 3 levels higher, capturing a ~6% profit on every cycle. Notice how “BUY 1” corresponds to “SELL 1”, “BUY 2” to “SELL 2”, and so on. This is automated profit maximization in its purest form.


A chart of ETCUSDT demonstrating the skip-level feature, with buys and sells happening 3 levels apart for a 6% profit.

Each sell order is executed 3 grid levels above its corresponding buy order.

The Official ATHgrid 1.2 Trailer

Words and pictures can only say so much. Watch our new promotional video to feel the power and simplicity of ATHgrid 1.2 and see how it turns market volatility into your personal ATM.

Summary: The Next Evolution of Grid Trading is Here

ATHgrid 1.2 with the “Skip-Level” feature is more than just an update; it’s a new way to approach automated trading. By giving you the power to define larger profit targets within your grid, you can significantly increase your profitability without increasing your workload or emotional stress.

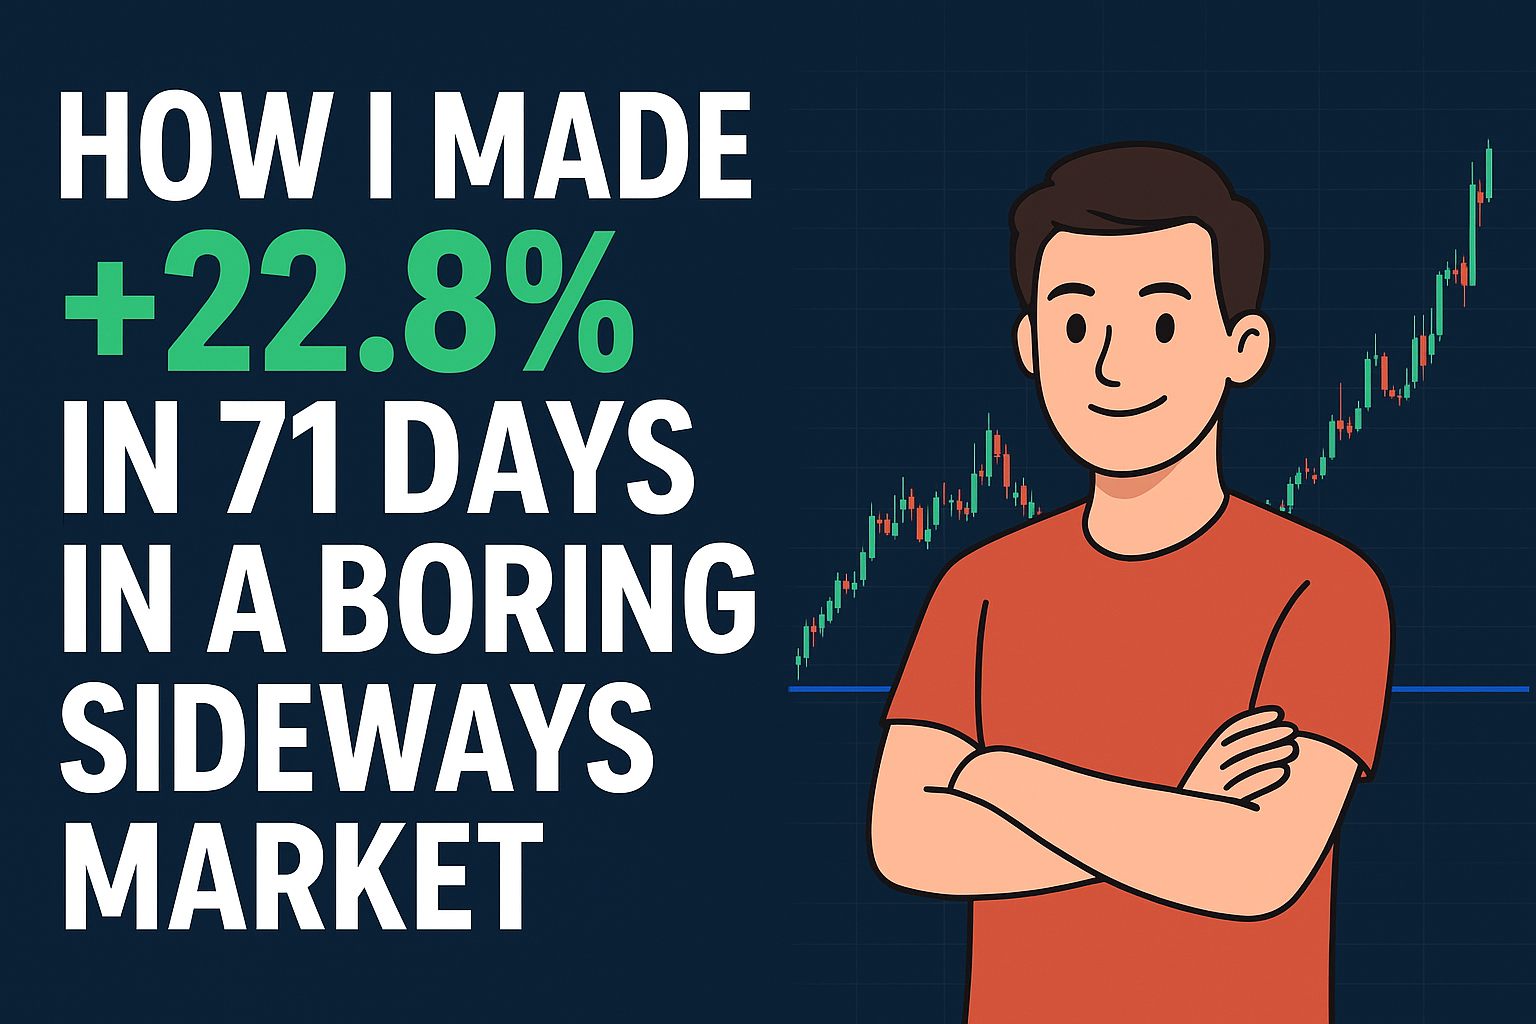
How I Made +22.8% in 71 Days in a Sideways Market

How I made +22.8% in 71 days in a sideways market - a case study.

A real-world Grid Trading case study on BIOUSDC

For most traders, a sideways trend is the worst period in the market. Emotions fade, volumes decrease, and capital sits idle, waiting for a “real” move. But what if I told you that this “boring” period is the perfect environment for generating steady, passive profits? In this article, I’ll show you the real-world results of a Grid Trading bot on the BIOUSDC pair and reveal how a new feature in ATHgrid will soon allow you to maximize these profits even further.

The Setup: Why the BIOUSDC Pair?

Success in Grid Trading starts with choosing the right market. The BIOUSDC pair on TradingView was an ideal candidate for several reasons. It has been moving within a clearly defined, wide price range for months. The lack of a strong uptrend or downtrend, combined with constant daily volatility, created the perfect conditions for a bot that profits from price fluctuations by buying low and selling high.


Chart of the BIOUSDC pair showing a sideways trend, ideal for Grid Trading.

The clear price range on the BIOUSDC pair.

The Results: The Numbers Speak for Themselves

After 71 days of uninterrupted work, with a simple 2% grid setup and without my active involvement, the ATHgrid bot achieved the following results:


Screenshot of the ATHgrid bot results: 338 take profits and 22.80% profit in 71 days.
  • Uptime: 71 days
  • Grid Spacing: 2%
  • Number of Take Profits (TPs): 338
  • Profit on Active Capital: +22.80%

While other traders were getting frustrated by the lack of movement, the system was methodically closing an average of 4-5 profitable trades per day. This is the power of automation – turning market chaos and boredom into consistent income.

Teaser: A New Profit-Maximizing Feature Coming to ATHgrid

Currently, the bot takes profit at the next, closest grid level. But what if we could increase the profit from every single trade? I’m proud to announce that a new, advanced feature is coming soon to ATHgrid!

Users will be able to decide how many grid levels up their profit is realized.

Instead of selling at the next level, you’ll be able to set a sale every 2, 3, 4, or more levels higher. The bot will still accumulate assets at every level on the way down, but the profits will be realized at much higher targets. It’s a simple change that dramatically increases the percentage profit per trade and allows you to build compound interest even faster.

Summary and What’s Next

As this case study shows, Grid Trading is a powerful strategy that allows you to make money in conditions where most traders are sitting on the sidelines. It’s a systematic approach that eliminates emotion and turns volatility into your ally.

In a future article, I will provide detailed simulations and a guide on how to effectively use the new Take Profit level setting to maximize your results. Stay tuned!

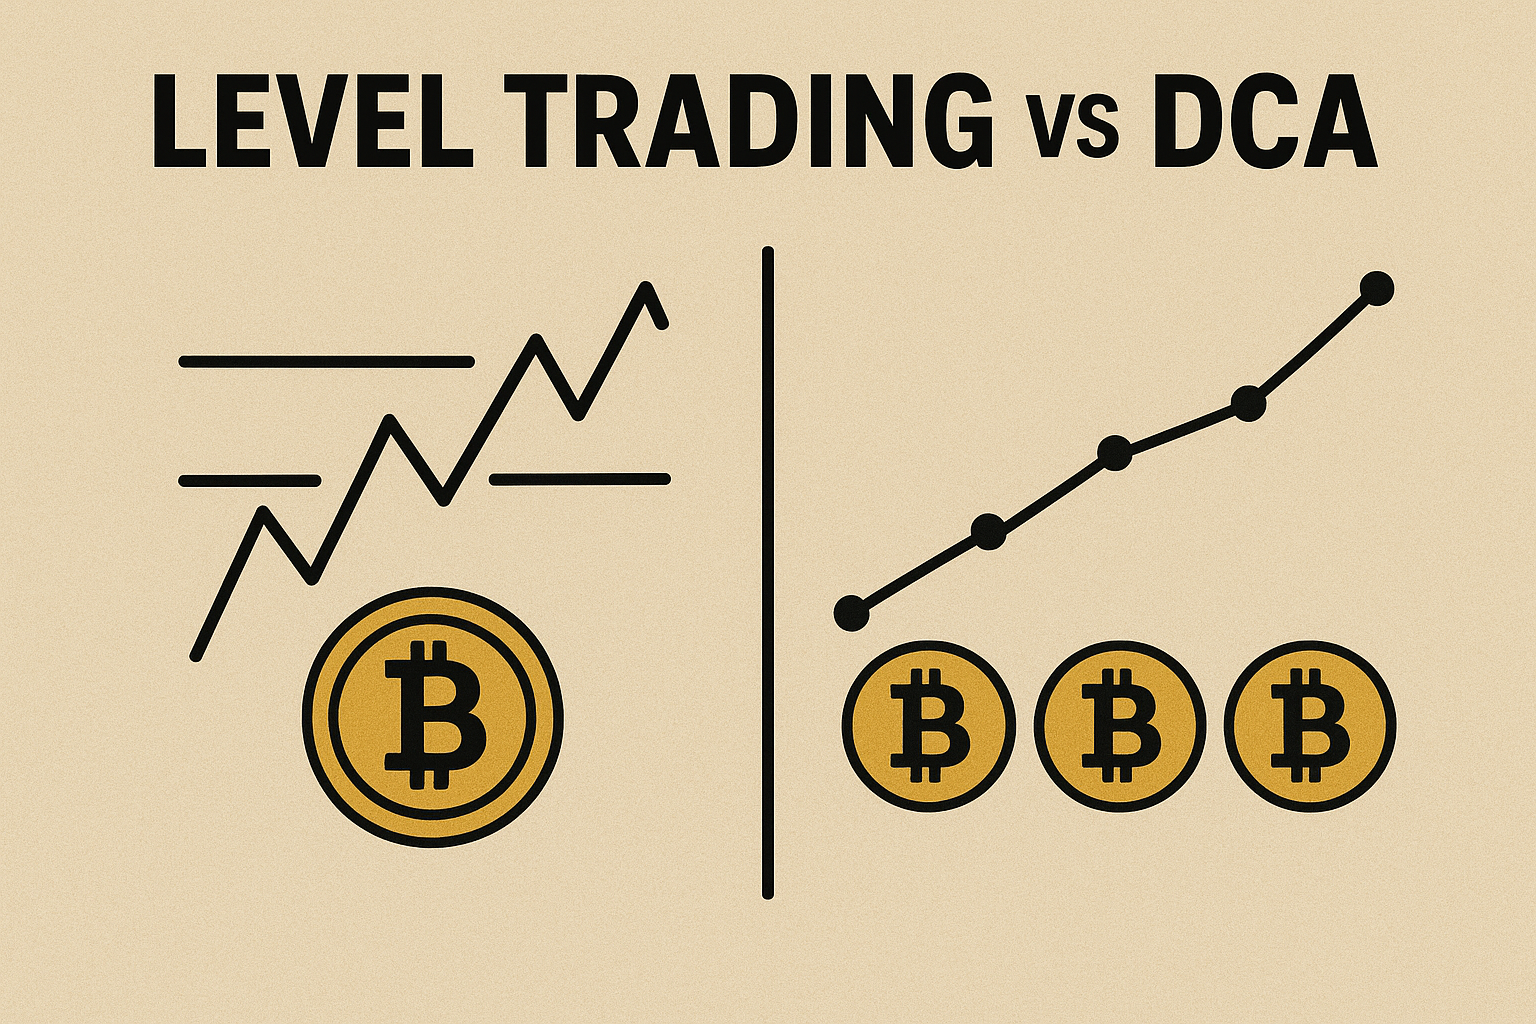
Level Trading vs DCA

Level Trading vs DCA - a comparison of crypto investment strategies.

Level Trading vs. DCA – A Strategy for Long-Term Players

In the world of cryptocurrency investing, there are many approaches to capital management. One of the most popular methods is Dollar-Cost Averaging (DCA), which involves systematically buying a given cryptocurrency at regular intervals, regardless of the price. While DCA has its advantages – simplicity and minimal time commitment – it also has drawbacks: capital is often frozen for a long time, and the investor must wait for the price to exceed their average entry. An alternative is Level Trading, which allows you to treat each position separately, realize profits faster, and repeatedly play the same price zones, combining elements of trading and long-term investing.

What is Level Trading?

The Level Trading strategy involves identifying key support and resistance zones on a chart (most often on D1, W1, or M1 intervals) and building a position only when the price reaches these areas. Each transaction is independent – there is no averaging as in DCA.

Key principles of the strategy:

  • Identify 3-4 major price zones based on a weekly or monthly chart.
  • Set buy limit orders at these levels.
  • Treat each position separately – you sell 100% of the position at a predetermined target (Take Profit).
  • Replay the same zones – if the market returns to the same level, you can re-enter and play it again.
  • Free up capital – thanks to this, you realize profits cyclically instead of waiting months for your average purchase price to break even.

Example: A Hypothetical BTC Scenario

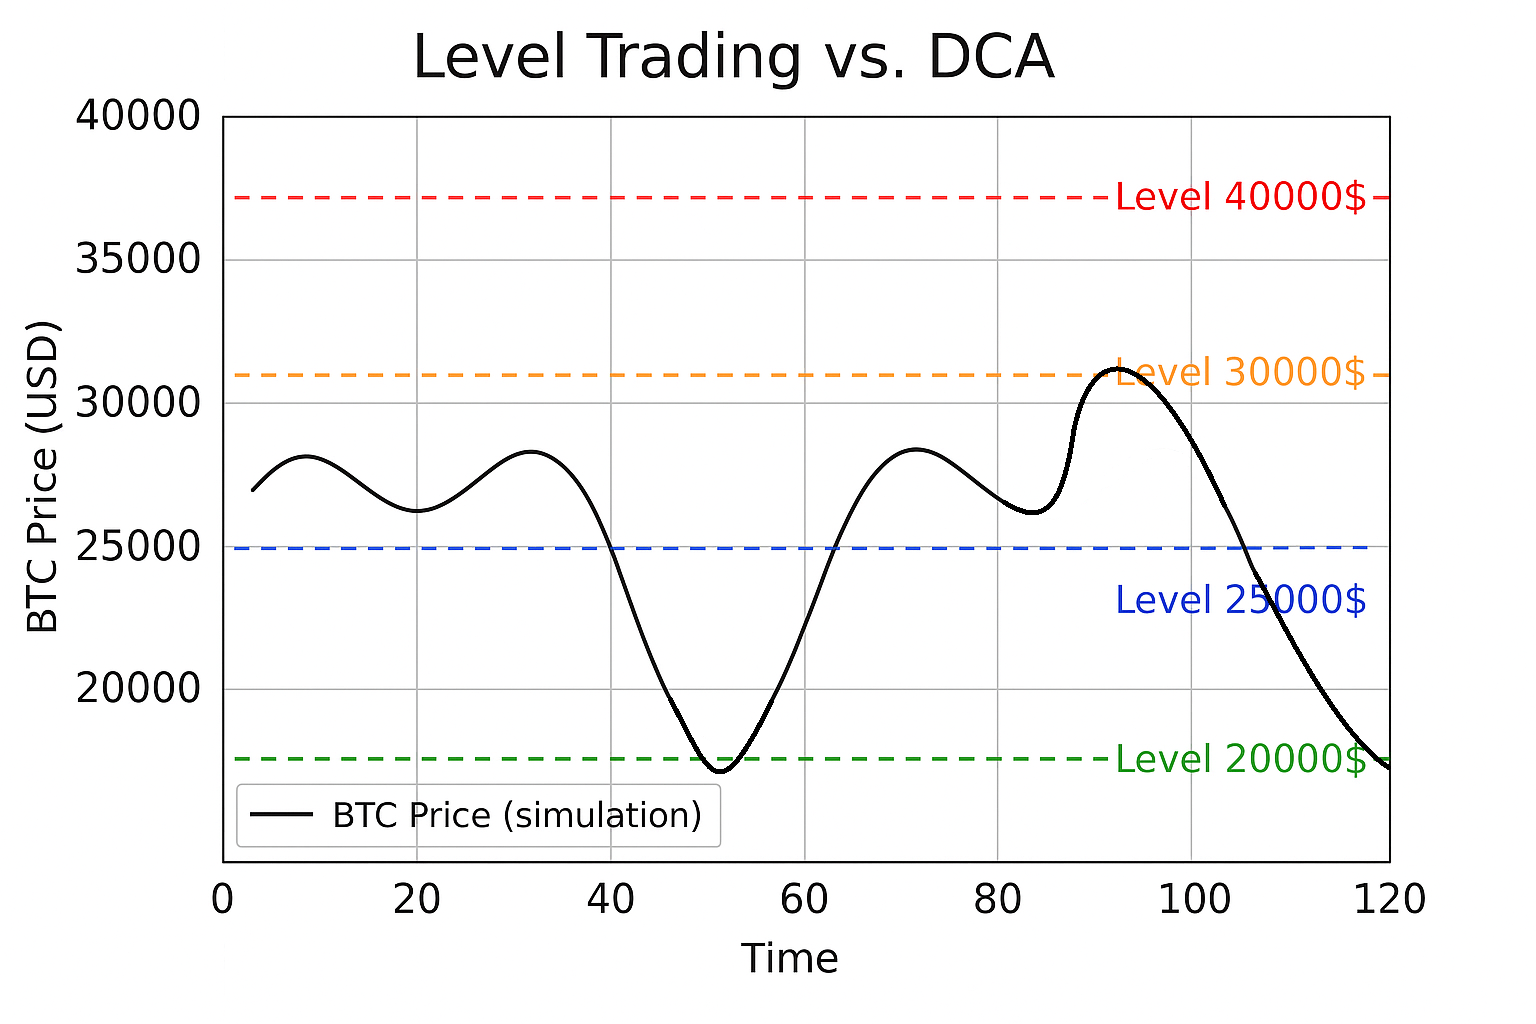
Let’s assume BTC is moving in a large price range between $20,000 and $40,000, and we want to play several levels. Our plan could look like this:

  • Level 1: Buy at $20,000 → Sell at $25,000 (+25% profit)
  • Level 2: Buy at $25,000 → Sell at $30,000 (+20% profit)
  • Level 3: Buy at $30,000 → Sell at $40,000 (+33% profit)

When BTC drops to 20k, your order is filled, and you set a sell order at 25k. If the market drops to 20k again – you have a second opportunity for the same profitable trade. Your capital is constantly working, and you are cyclically taking profits.

A simulation chart of BTC price with key trading levels marked: 20000, 25000, 30000, 40000 USD.

Hypothetical buy/sell levels for BTC.

Comparison: DCA vs. Level Trading

Feature DCA Level Trading
Simplicity ✅ Very simple ❌ Requires level analysis
Time Commitment ✅ Minimal ✅ Low (high timeframes)
Risk of Frozen Capital ❌ High ✅ Low (cyclical profit-taking)
Profit Potential ❌ Limited ✅ Higher with a good plan
Flexibility ❌ None ✅ Full control over positions

Why This Strategy Excels in Crypto?

The cryptocurrency market is characterized by immense volatility. Moves of 20-30% in a short time are normal. Level Trading allows you to use this volatility instead of fighting it. Instead of watching your DCA portfolio drop by -50%, you are realizing further profits at lower levels, accumulating capital for the next move up.

Summary

Level Trading is a strategy that combines the simplicity of long-term investing with the efficiency of trading. Thanks to it, you are not dependent on an average purchase price like in DCA; you manage each position individually and use the natural cycles of the crypto market to generate repeatable profits.

Want to automate your Level Trading strategy? Discover ATHgrid and let a bot execute your plan with precision 24/7.

Crypto Capital Management: Build Your Fortress for Long-Term Profit

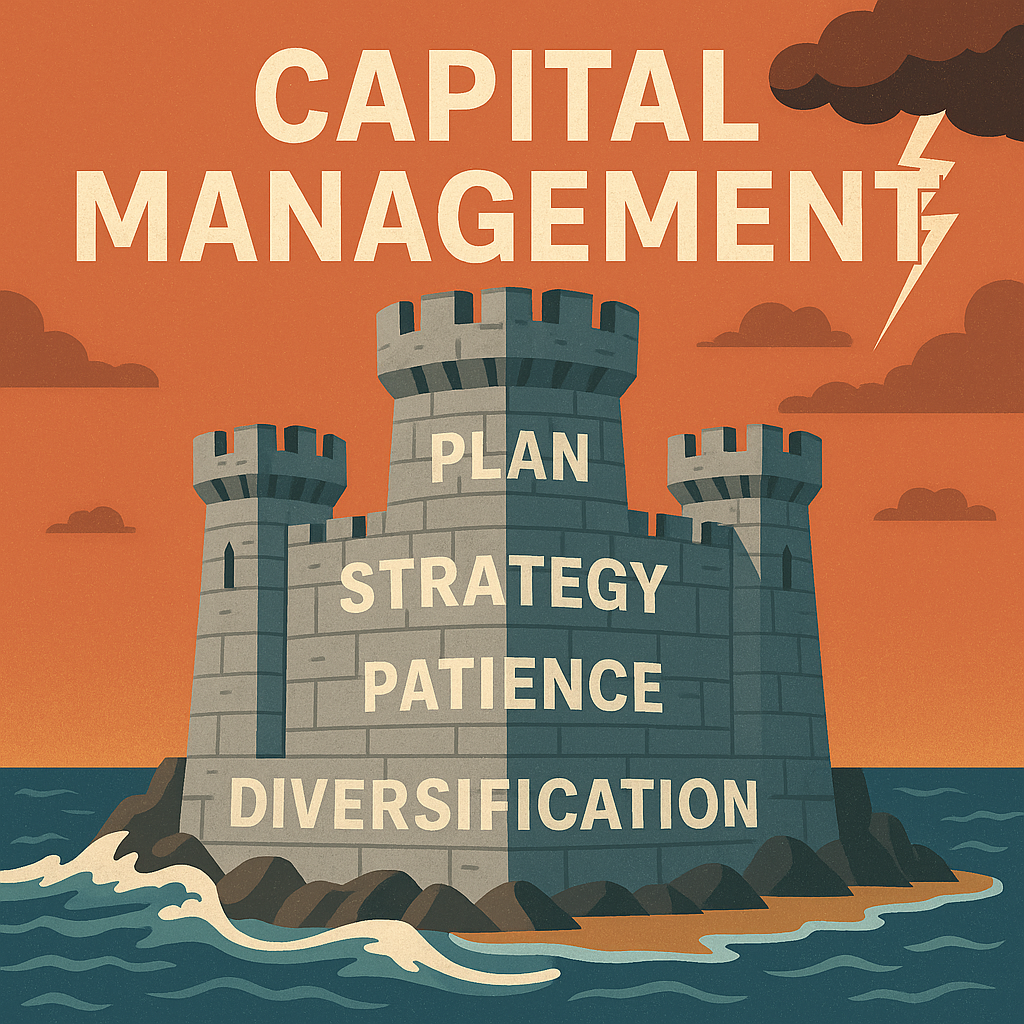
Capital management as a fortress with the words Plan, Strategy, Patience, Diversification.

Capital Management: Why Your Plan is More Important Than Your Trades

In the chaotic world of crypto trading, most people are searching for the perfect entry, the secret indicator, or the one trade that will change their lives. But they are looking in the wrong place. Your long-term success is determined not by your trading prowess, but by something far more crucial: your capital management. Without a solid plan and strategy, you can’t build a financial fortress. You’re just a gambler waiting to lose.

The Cracks in the Walls: 10 Mistakes That Demolish a Trader’s Fortress (Capital Management)

Before you can build, you must understand what causes collapse. Most trading accounts are destroyed by a series of predictable, self-inflicted mistakes rooted in flawed psychology and strategy.

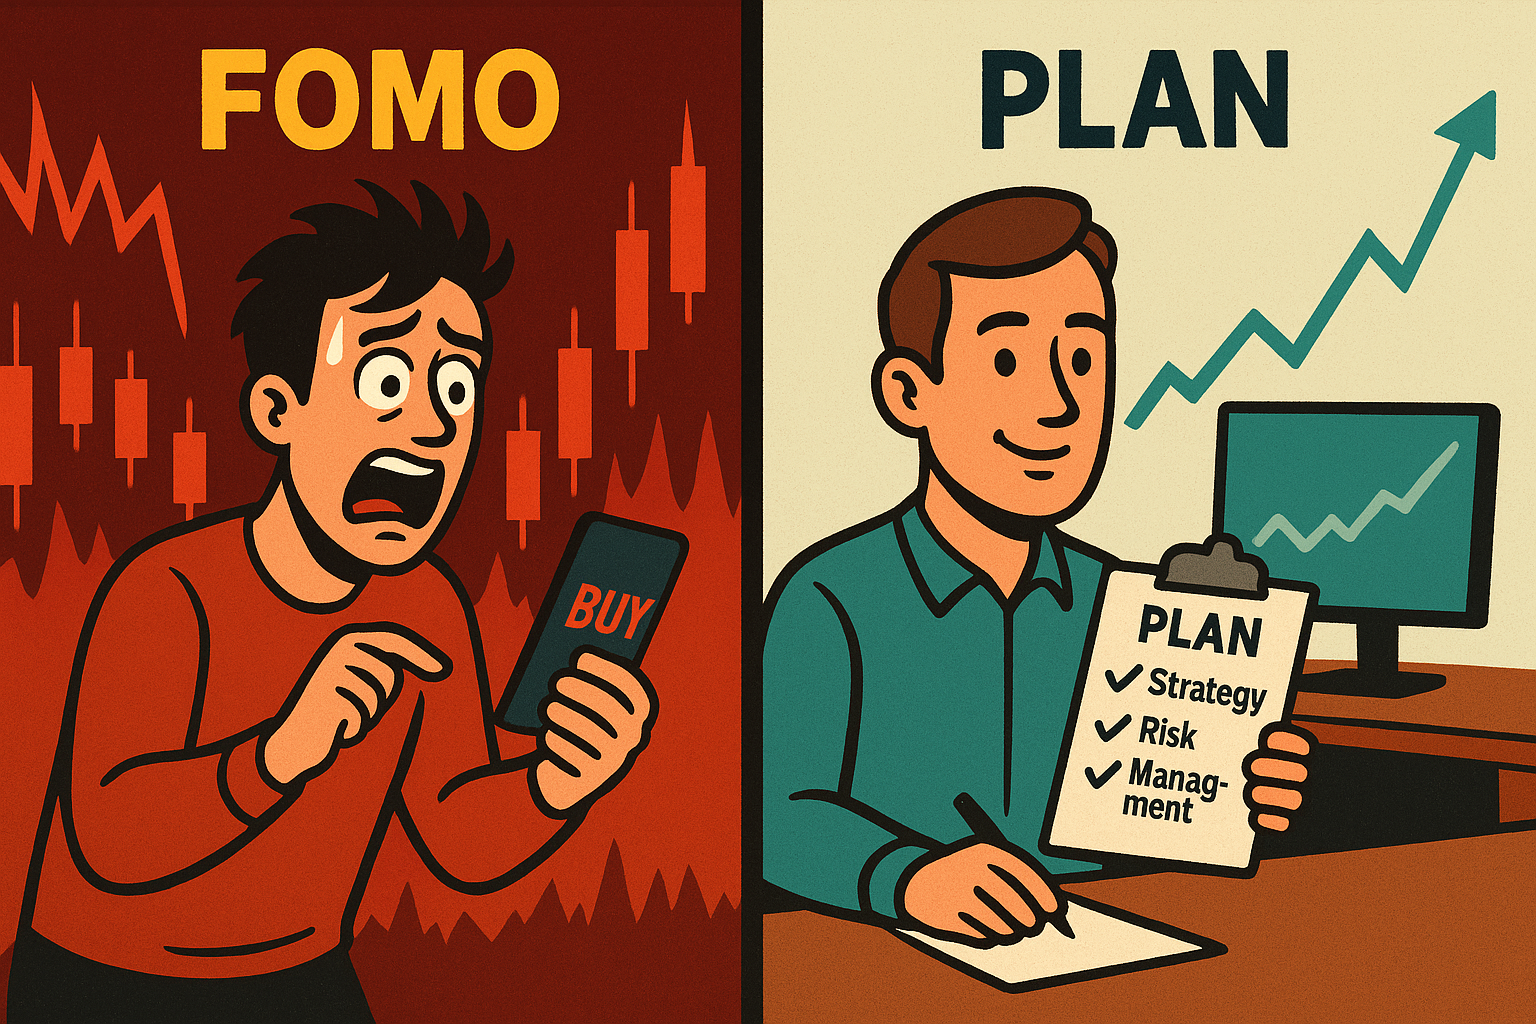
A trader driven by FOMO vs a calm trader with a plan.

Are you trading based on emotion or a concrete plan?

1. “Gut Feeling” Trading (Based on Emotion)

This is a trader’s cardinal sin. Decisions made based on a “hunch,” excitement, or fear, instead of a tested strategy, are a direct path to blowing up your account. The market doesn’t reward hope, it rewards a well-executed plan.

2. Chasing Profits (FOMO)

You see a green candle shooting for the sky and feel the compulsion to buy, otherwise you’ll miss a life-changing opportunity. That’s FOMO (Fear Of Missing Out). The brutal truth is: if you weren’t buying at the bottom, buying at the peak of euphoria is statistically the worst possible time to enter the market.

3. Lack of Patience

Impatience destroys even the best plans. It leads to closing profitable positions too early (out of fear of giving back profits) or holding losing trades for too long (in the hope that “it will bounce back”). Discipline and sticking to the plan are key.

4. Ignoring Risk

Every professional is a risk manager first, and a trader second. Entering a position without a defined stop-loss and without knowing the maximum you could lose is pure gambling. Always ask yourself: “How much will I lose if I’m wrong?”.

5. Overtrading

The feeling that you must be “in the market” at all times leads to forcing trades even when there are no good opportunities. Sometimes the best trade is no trade at all. Capital is like ammunition—don’t waste it on random shots.

6. Poor Math & Not Understanding Compound Interest

Many traders don’t understand the most powerful force in finance: compound interest. It’s the consistent reinvestment of even small profits that leads to exponential growth over the long term. The reinvestment feature in the ATHgrid bot is based on this very principle, turning small wins into a powerful snowball.

7. Wishful Thinking

Believing the market “has to” turn around because “it has dropped enough” or that “it will only go up” is a direct path to disaster. The market is indifferent to your hopes and expectations. Follow the data, not your wishes.

8. Ignoring Taxes and Inflation

A 50% gain in your account is not a 50% real profit. You have to subtract the taxes you will pay and the inflation that has diminished the purchasing power of your money during that time. Always think in terms of net profit.

9. Trading with Money You Need

This is a cardinal mistake. Using money from your emergency fund, living expenses, or, worst of all, loans, is the fastest way to ruin. Only trade with surplus funds that you can fully afford to lose, both financially and mentally.

10. Blindly Following “Gurus”

You can learn from experts and follow the analyses of others (including mine), but treating them as oracles is a mistake. Everyone is wrong sometimes. The final decision and responsibility always rest with you. Use the knowledge of others to build YOUR OWN management plan.

Building Your Fortress: A Practical Allocation Plan

So, how do you build your fortress? You create a clear, written plan for how your capital will be allocated. This removes emotion and guesswork. Here is a sample strategy you can adapt:

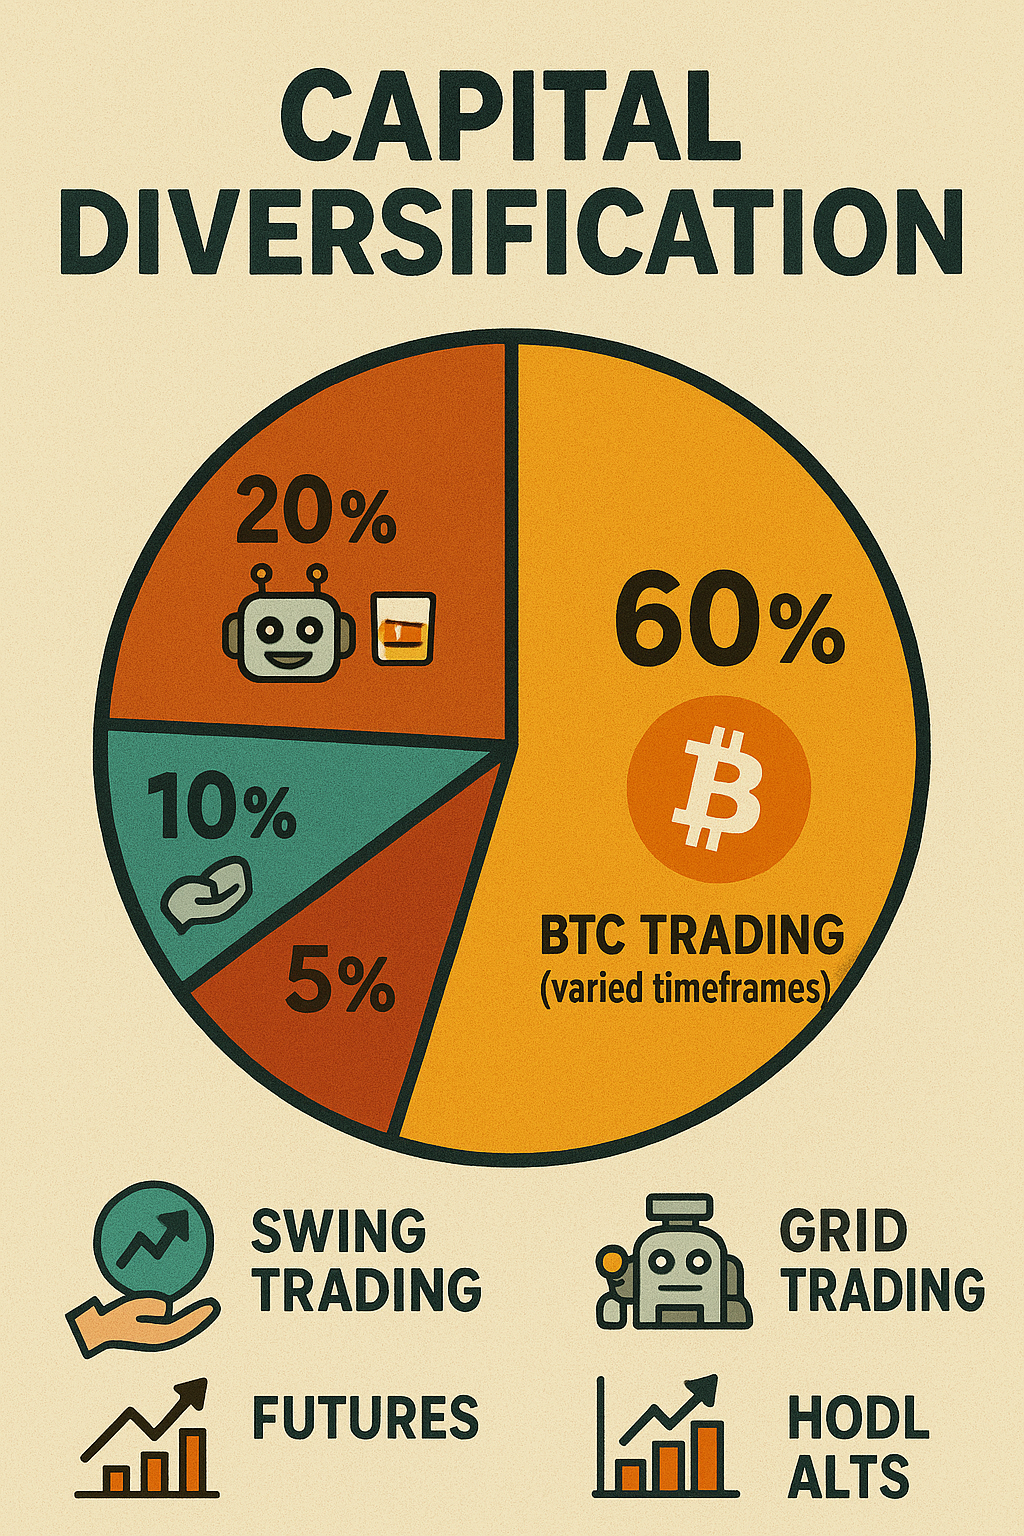
A pie chart showing capital diversification: 60% BTC Trading, 20% Grid Trading, 10% HODL Alts, 5% Swing Trading, 5% Futures.
  • 60% – Bitcoin Trading: This is the core of your fortress. Your capital is allocated to trading the most established asset in different timeframes (long, medium, and short-term).
  • 20% – Grid Trading: This is your automation wing. Set up bots on volatile pairs and let them work 24/7. This is the part of your plan that earns while you sleep, profiting from market noise. Time for a glass of whisky while the system works.
  • 10% – HODL Altcoins: A portion of your capital dedicated to holding high-potential altcoins that you believe in long-term.
  • 5% – Swing Trading: Actively trading specific altcoin setups over days or weeks.
  • 5% – Futures: A small, high-risk portion for leveraged trading, if you have the expertise.

The key is to define your percentages and stick to the plan. Haste and greed will destroy you; patience and discipline will build your fortress, brick by brick.

Conclusion and What’s Next

Stop focusing only on finding the next winning trade and start focusing on building a resilient capital management system. Your plan is your shield and your sword in the market battlefield.

In the next article, I will dive deeper into a specific strategy: how to buy at key levels and why it’s often a better approach than classic DCA (Dollar-Cost Averaging). Stay tuned.

FOMO vs. A Cool Head: Why a Rising Market Should Scare You, Not Excite You

FOMO vs. a Cool Head in trading

FOMO vs. A Cool Head: Why a Rising Market Should Scare You, Not Excite You

Ask yourself a simple question: when do you feel the strongest urge to buy cryptocurrencies (or any other asset)? It’s probably when everyone on X (Twitter) is posting about insane profits, and the green candles on the chart seem endless. This feeling, this mix of excitement and fear that you’re missing out on a life-changing opportunity, has a name: FOMO (Fear Of Missing Out). And it is the main reason why most people lose money.

Your Brain Was Not Designed for Trading

Our brain evolved over thousands of years to help us survive in a herd. Following the crowd was safe. Being excluded meant danger. FOMO is nothing more than this primal instinct transferred to the financial markets. The problem is, in the stock market, the logic of the crowd works in reverse. When everyone is buying in euphoria, it usually means that “smart money” is already selling their assets to them at inflated prices.

Let’s imagine a simple example. At first, a handful of visionaries buy a unique item, seeing its potential while others ignore it. Over time, a trend builds around the item. Suddenly, at the peak of its popularity, owning it becomes a necessity. The crowd rushes to buy, driving the price to absurd levels.

What do the original owners do? Seeing this insane demand, they calmly sell their items to the crowd, realizing huge profits. Eventually, a saturation point is reached – everyone who wanted to buy has already done so. The problem is, the last buyers are left with an asset that no one wants anymore, and they have no one to sell it to at a higher price. The value begins to plummet.

The Cycle of Emotions – A Map of Your Future Failure

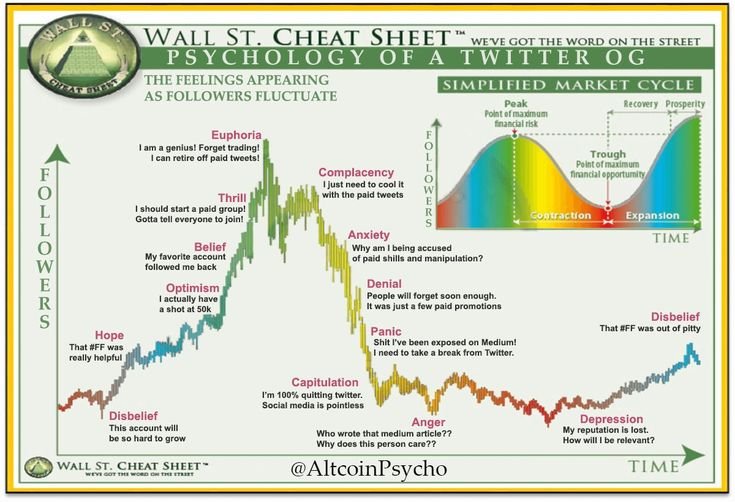
The chart below is the “Wall Street Cheat Sheet” the most famous map of market emotions. Find the “Euphoria” point on it. This is the moment when you feel like a financial genius and are certain of further gains. It is also the peak of the bubble, right before the biggest crash. It works every time.

Market Emotions Cycle Chart - Wall St. Cheat Sheet

Euphoria is the point of maximum financial risk.

Professional investors act contrary to this cycle. They buy when “Depression” and “Disbelief” prevail on the chart. They sell during “Thrill” and “Euphoria.” They understand that a rising chart and widespread optimism are signals to start being afraid and take profits, not to join the party.

How to Win Against Yourself? Stop Fighting.

You can read hundreds of books on trading psychology, but the moment large sums of money (or large losses) appear in your account, your primal instincts will take over anyway. The fight against your own psyche is doomed to fail. The only effective solution is to completely remove emotions from the decision-making process.

How to do it? Automate your strategy.

Automated trading bot

ATHgrid: Your Cool Head in Code Form

This is the philosophy behind systems like Grid Trading. Instead of making frantic decisions based on fear or greed, you establish a logical action plan and let a program execute it for you.

A tool like ATHgrid is your personal, emotionless trader. It:

  • Doesn’t feel FOMO when the market is rising.
  • Doesn’t panic when the price drops.
  • Systematically buys low and sells high as part of your strategy, 24/7.

Instead of being a slave to the cycle of emotions, you become its observer, while your system methodically works for your profit. This is true psychological freedom in trading.

Ready to hand over the trading to a machine and keep the peace of mind for yourself? Discover ATHgrid and see how systematic trading beats emotions.

TOTAL3 Chart vs Altseason: Key Levels You Must Know


TOTAL3 vs Altseason - What to Look At

TOTAL3 vs. Altseason: The One Chart That Reveals Everything

While the market is buzzing with speculation about the next altseason, experienced investors know that hope is not a strategy. Instead of guessing, they turn to data. And when it comes to the health of the altcoin market, no chart is more important than TOTAL3 – the total market capitalization of all cryptocurrencies, excluding Bitcoin and Ethereum.

What Exactly is the TOTAL3 Chart?

Simply put, TOTAL3 measures the total value of the entire altcoin market. It strips out the influence of the two giants, BTC and ETH, giving us the purest view of capital flowing into projects like Solana, Cardano, Chainlink, and thousands of others. You can track this chart live on platforms like TradingView. Why is this so crucial? Because a true, sustainable altcoin rally happens only when new money decisively enters this specific segment of the market.

Short-Term Analysis: The ABCs of a Potential Breakout

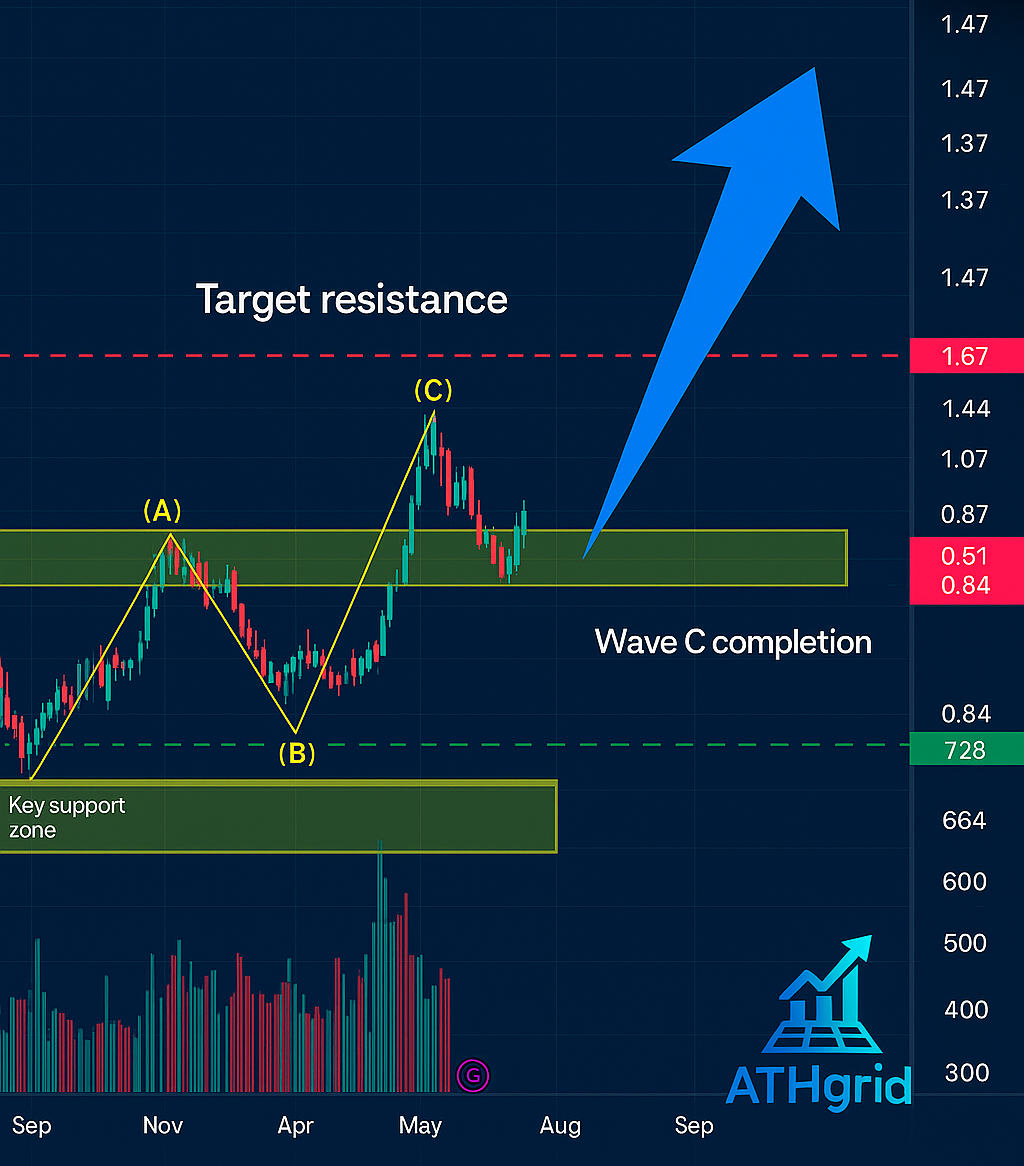
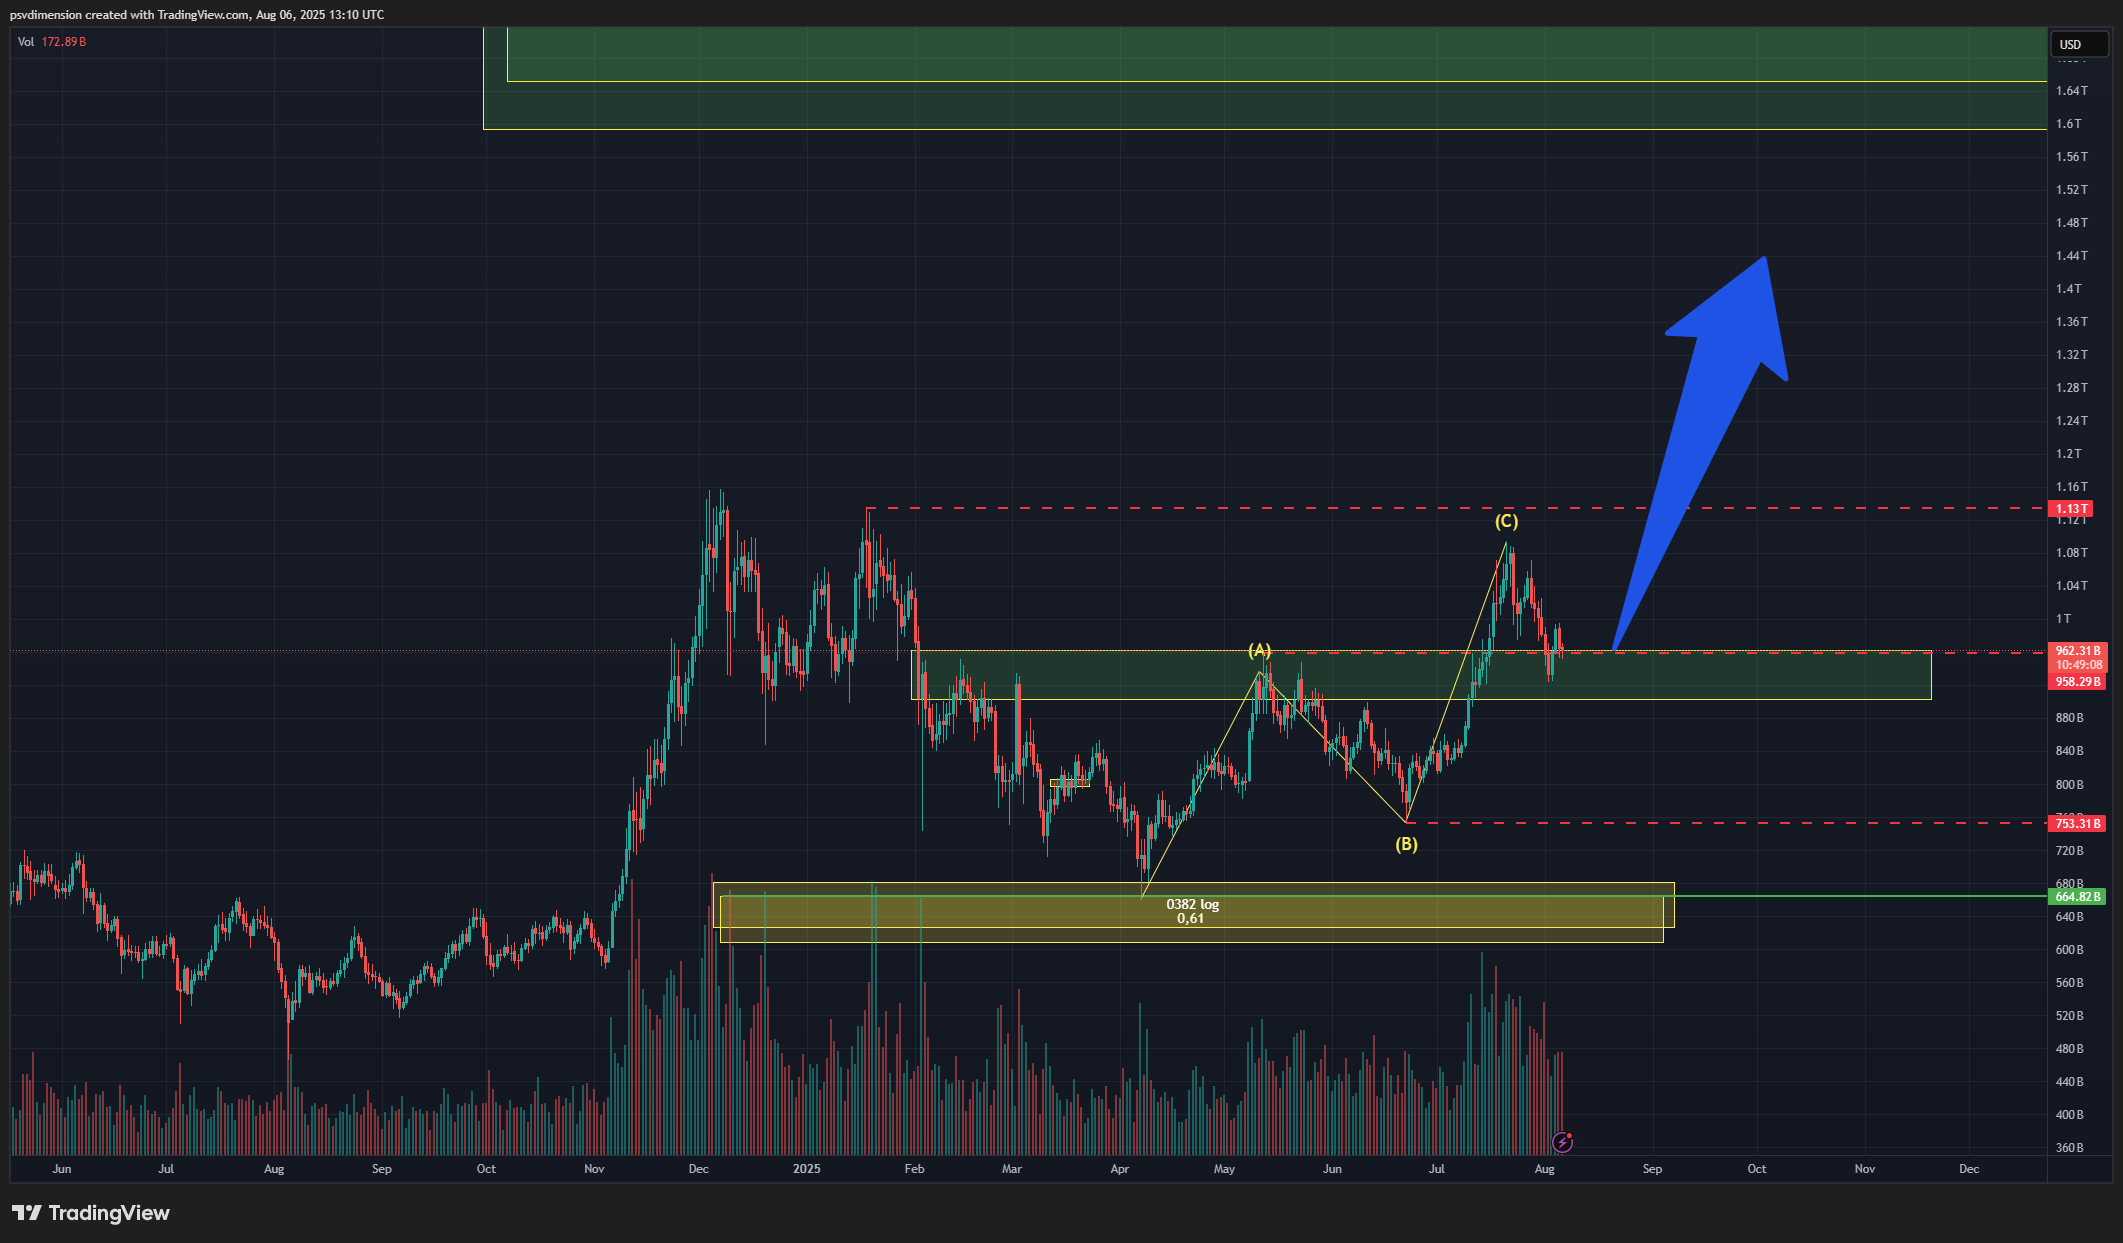
Looking at the recent price action on the TOTAL3 chart, we can see a classic ABC corrective pattern has formed. After completing Wave C, the price has now pulled back to a critical support zone – the area of the previous peak of Wave A. Holding this level is the first condition for the market to do “something more than just a 3-wave move.”

The key hurdle to overcome is the recent high at $1.13 trillion. A decisive break above this level would be a powerful bullish signal, giving altcoins a real chance to build upward momentum.


Short-term chart of TOTAL3 showing a completed ABC correction and a retest of the Wave A support zone. The key resistance is at $1.13T.

However, the most critical level to watch on the downside is the low of Wave B at $753.31 billion. A break below this support would invalidate the immediate bullish structure and signal further weakness.

The Bigger Picture: A Realistic Target for Altseason

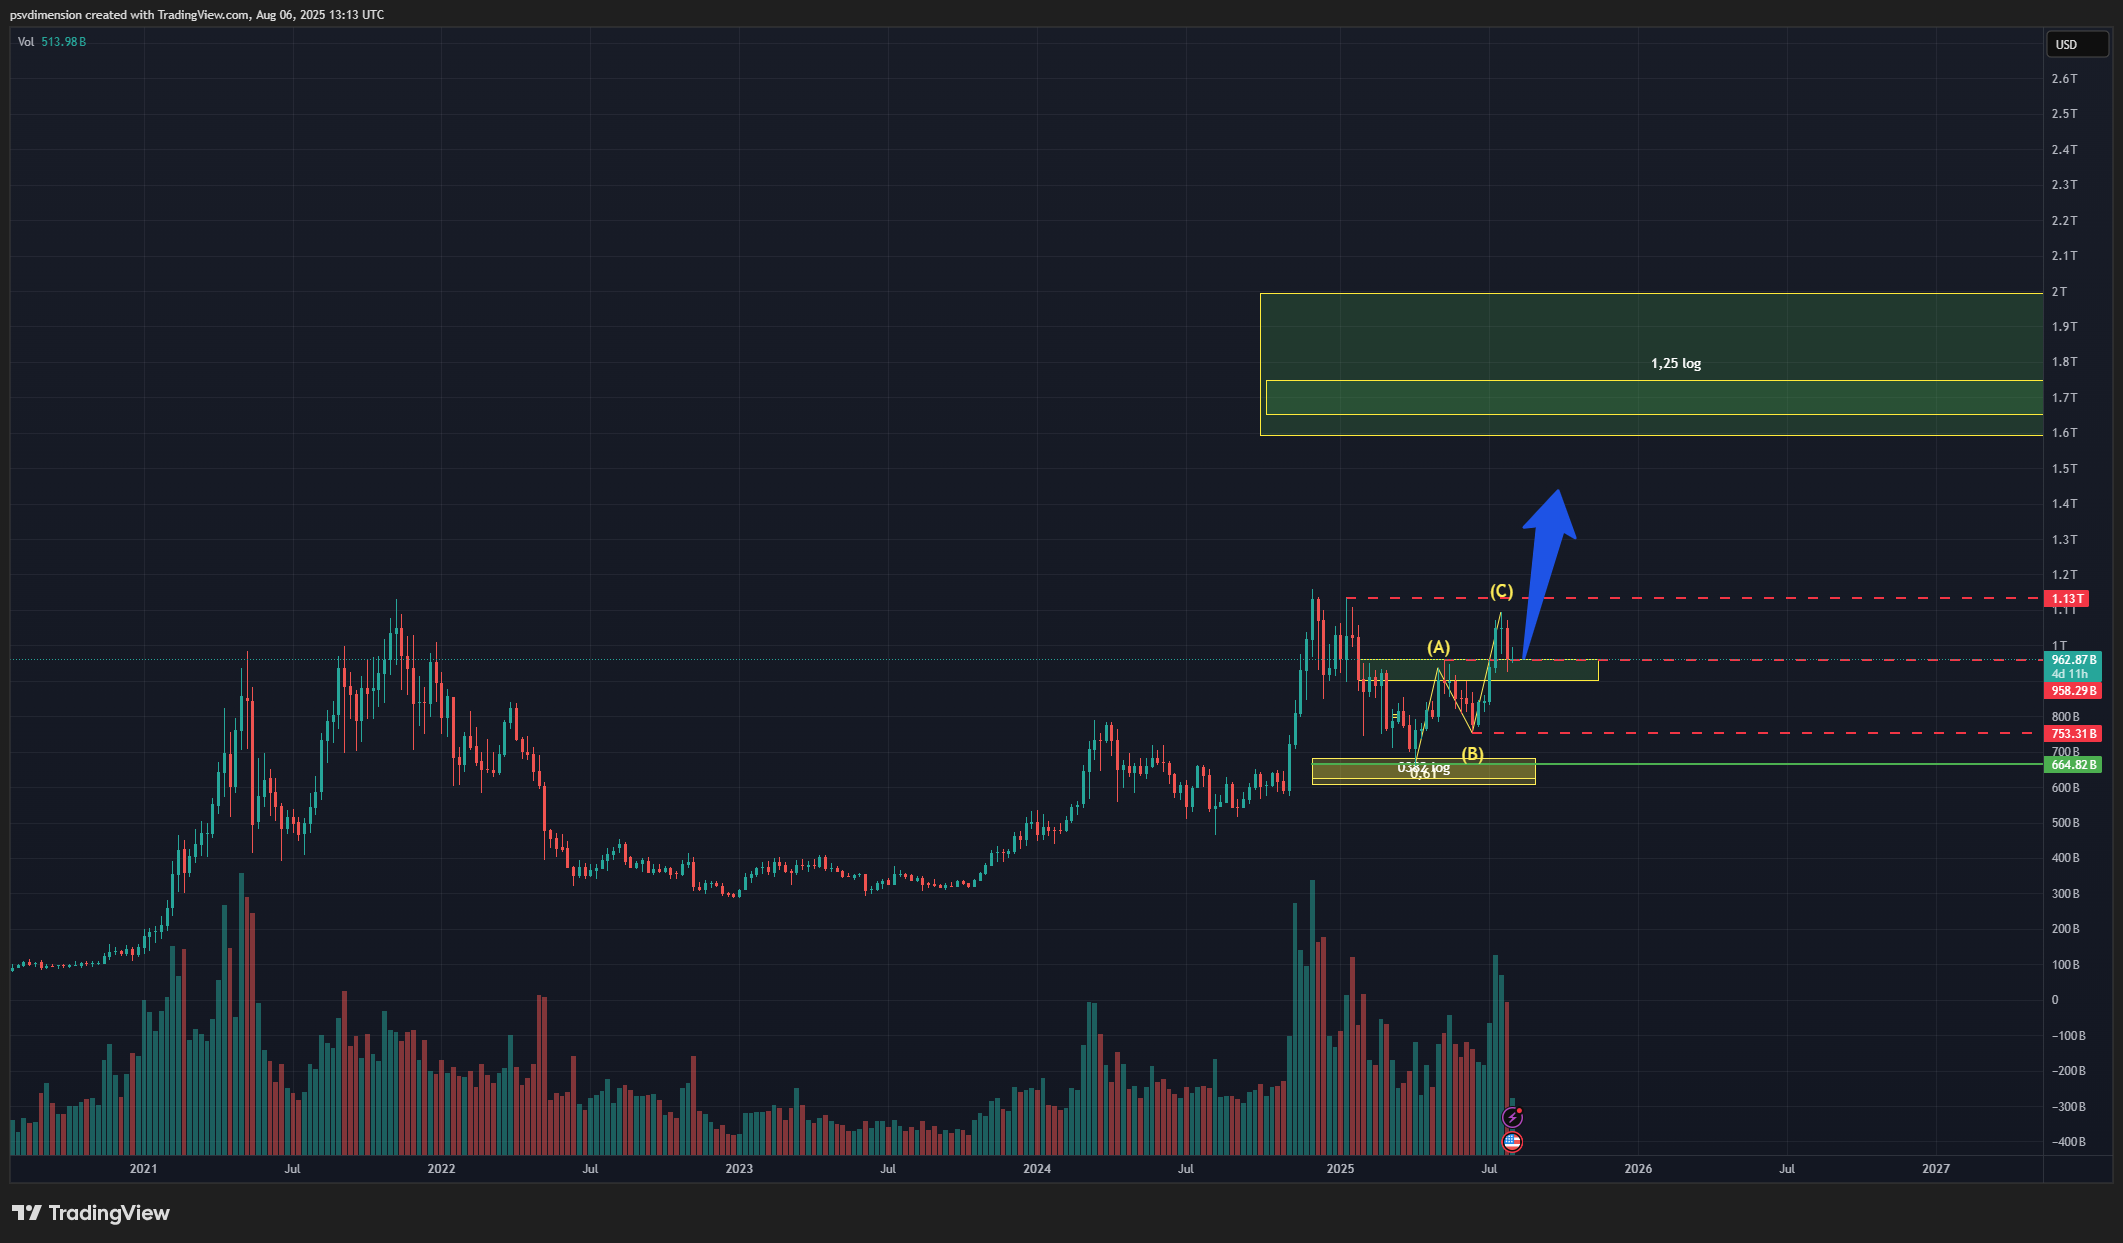
If the market successfully breaks the $1.13T resistance, where could we be headed? Looking at the long-term chart, the next major target is the resistance zone around $1.6 trillion. This isn’t a random number; this level corresponds to the 1.25 logarithmic scale measurement from the last historical market bottom.

Reaching this zone would represent a massive “breather” for altcoins, likely fueling a widespread rally and bringing significant relief to investors who have patiently waited.


Long-term chart of TOTAL3 showing the major resistance target at $1.6T, which corresponds to the 1.25 logarithmic scale level from the bottom.

Strategy Over Stress: How to Navigate the Uncertainty

So, we have a clear map: a support to hold, a resistance to break, and a target to aim for. But the outcome remains uncertain. This uncertainty is what causes stress, sleepless nights, and emotional decisions for most traders.

What if you could participate in the market’s volatility without having to guess the direction correctly? This is where a systematic, automated strategy like Grid Trading shines. A tool like ATHgrid allows you to set up a trading bot that automatically buys low and sells high within a range you define. It doesn’t care if TOTAL3 is going to $1.6T tomorrow or retesting support first. It simply trades the chaos, accumulating profits from every price swing.

It’s a strategy that allows you to live peacefully and sleep soundly, knowing your trading plan is being executed 24/7 without your emotional input.

Bitcoin Dominance (BTC.D) and Altseason: Do You Have a Plan?

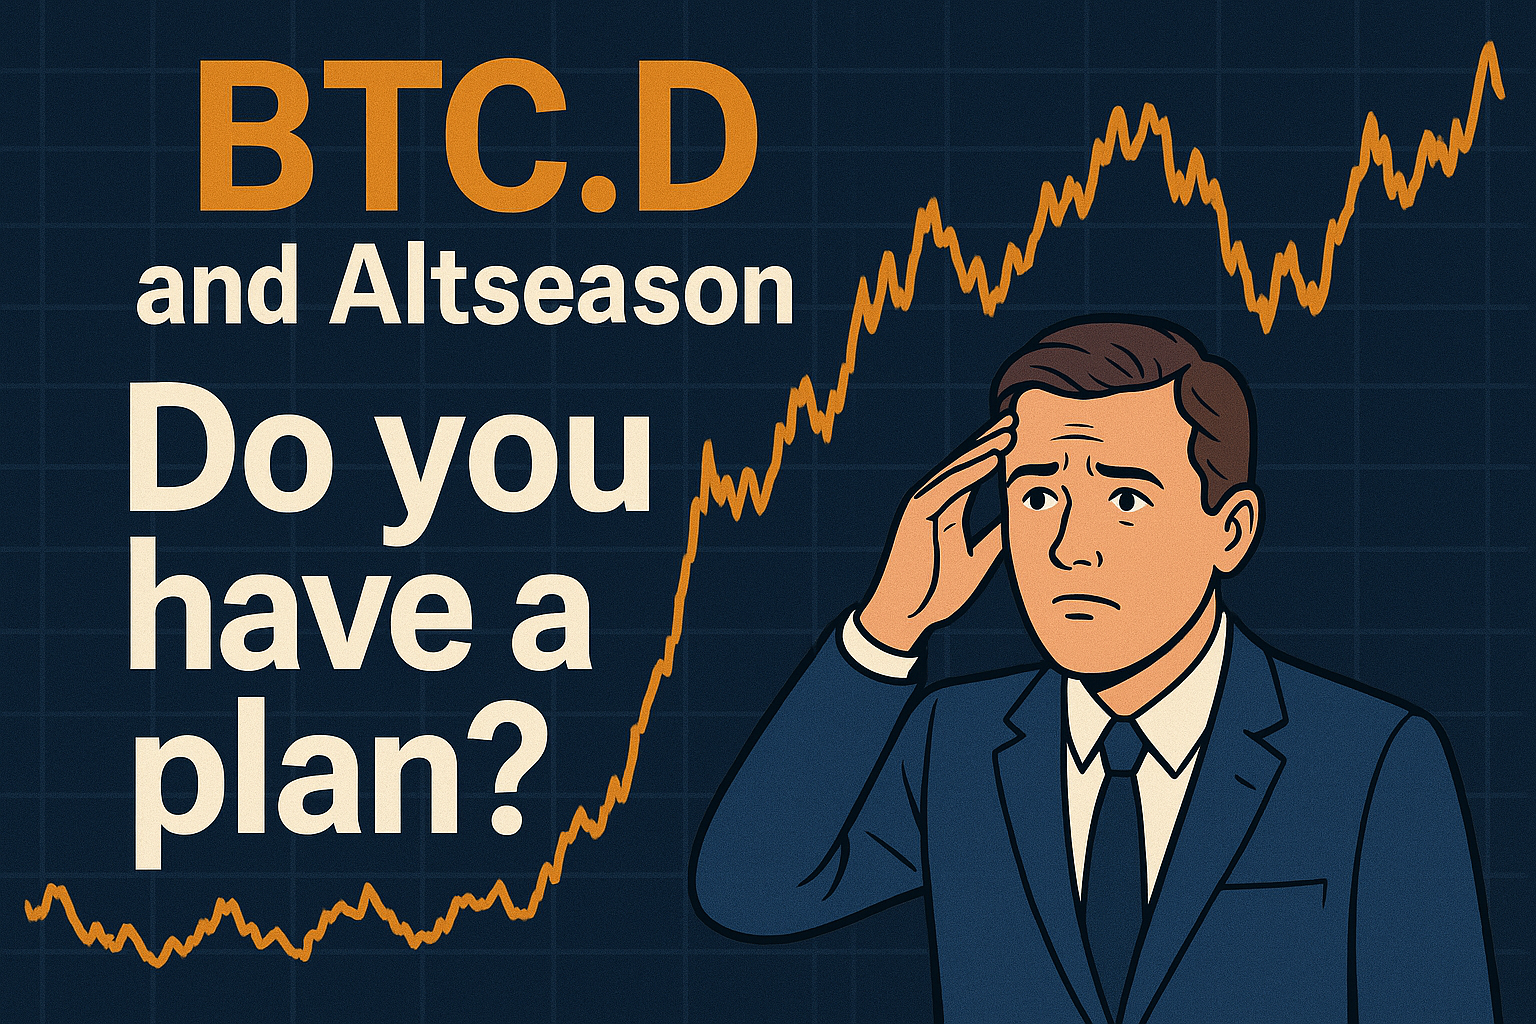
Bitcoin Dominance and its most important question:
“When altseason?” It’s the question on every crypto investor’s mind. While countless influencers offer predictions, experienced traders turn their attention to one single chart that tells the real story: Bitcoin Dominance (BTC.D). Understanding this metric is key to navigating the market and preparing a strategy, regardless of what comes next.

What is Bitcoin Dominance (BTC.D)?

Simply put, Bitcoin Dominance is the percentage of the total cryptocurrency market capitalization that is held in Bitcoin. You can track it live on platforms like TradingView. Why is this chart so important for altcoin investors?

Historically, it reveals the flow of capital within the crypto ecosystem. A true, explosive “altseason” typically follows a specific pattern:

  1. Money flows into Bitcoin first, causing its price to rise and BTC.D to increase.
  2. As Bitcoin’s momentum slows, profits are rotated into major altcoins (like ETH). This causes BTC.D to start falling.
  3. If the trend continues, capital then flows further down into mid and low-cap alts, causing widespread, parabolic gains across the board. This phase is marked by a sharp, sustained drop in Bitcoin Dominance.

Current Analysis: A Local Breakdown or Just a Pause?

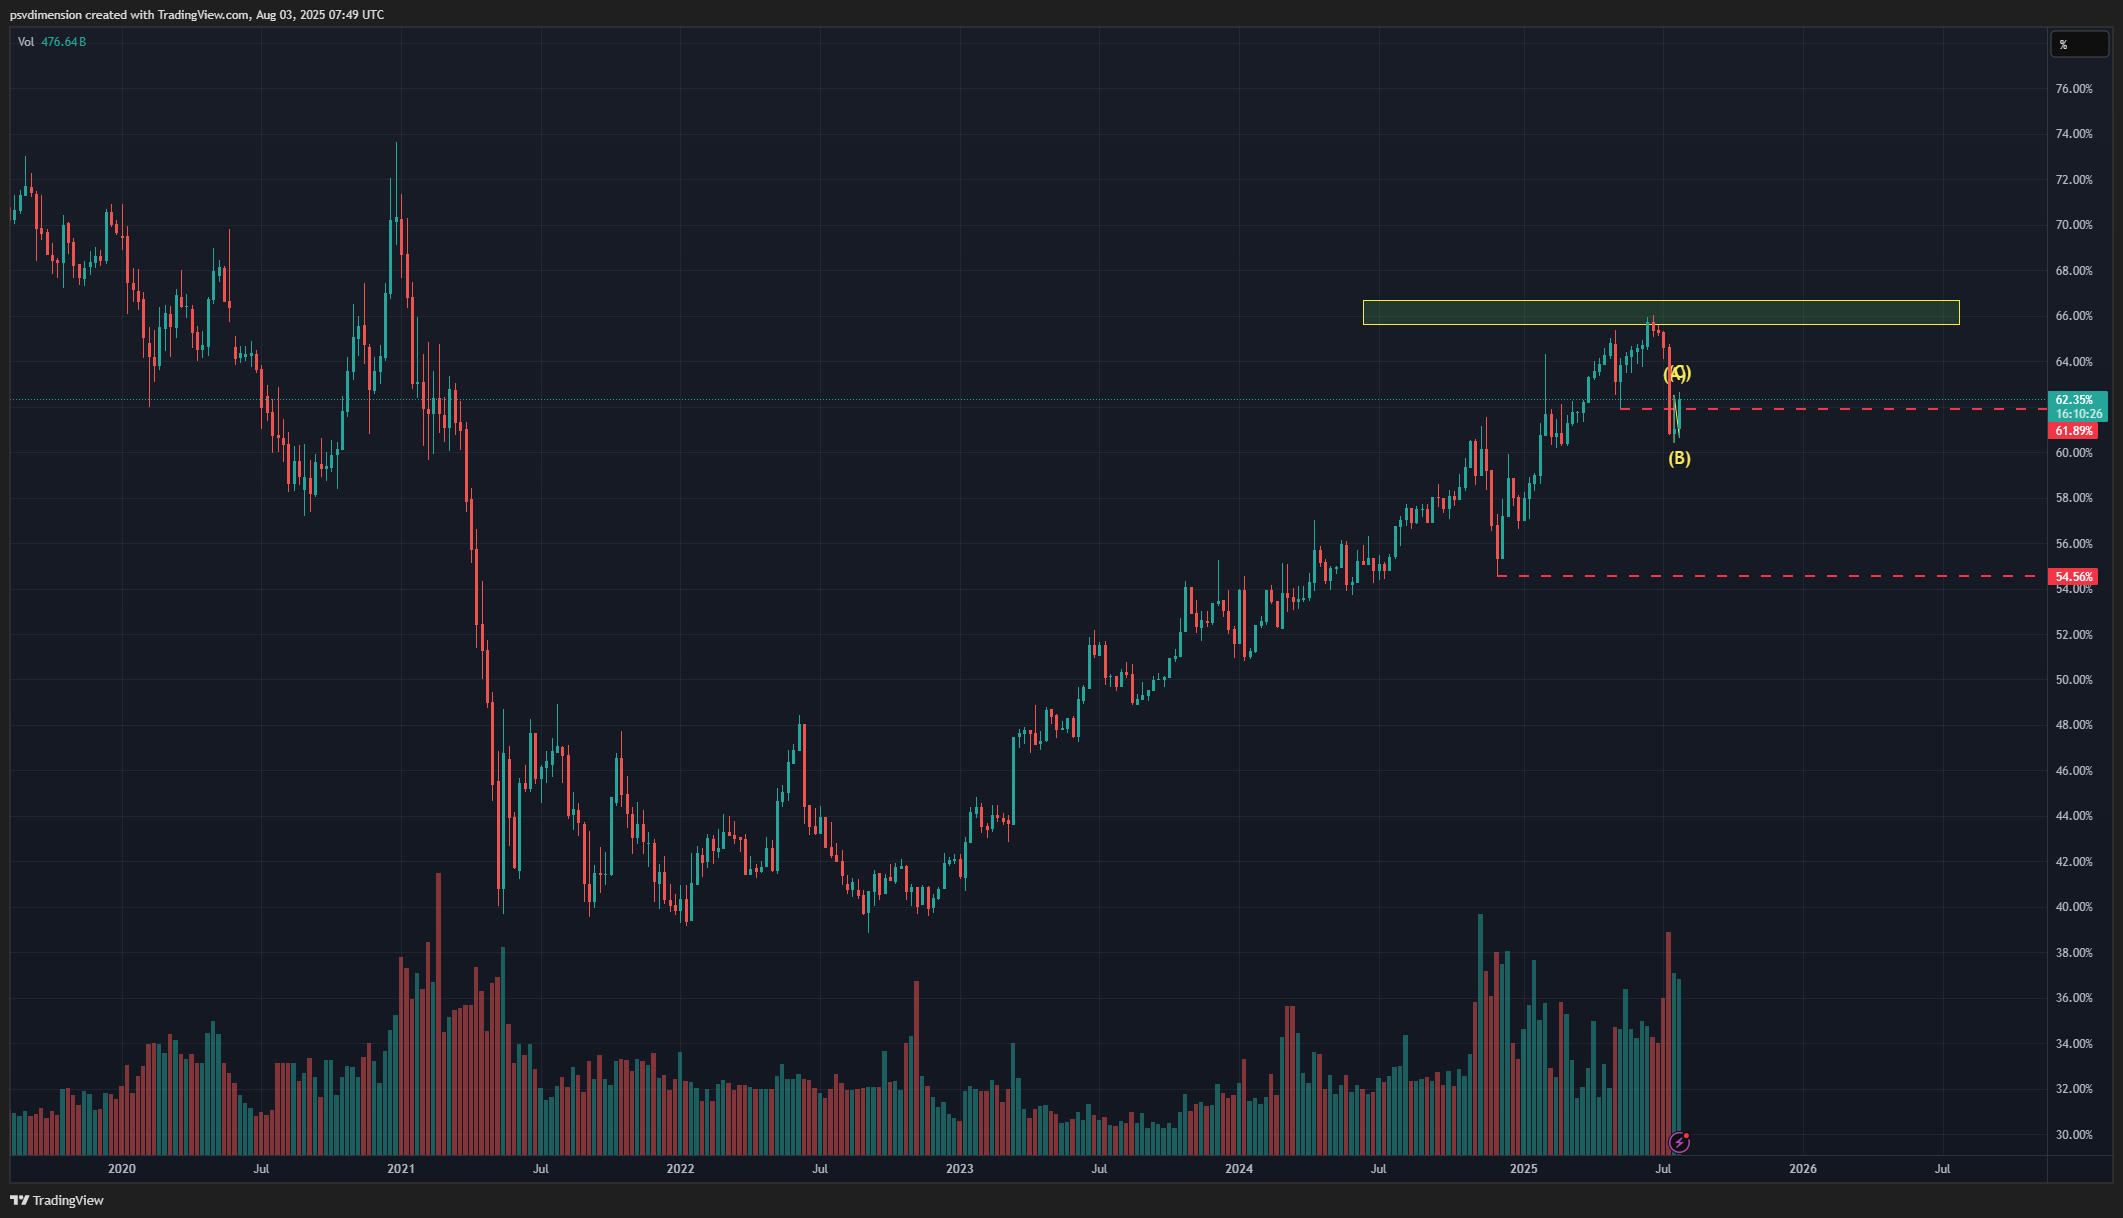
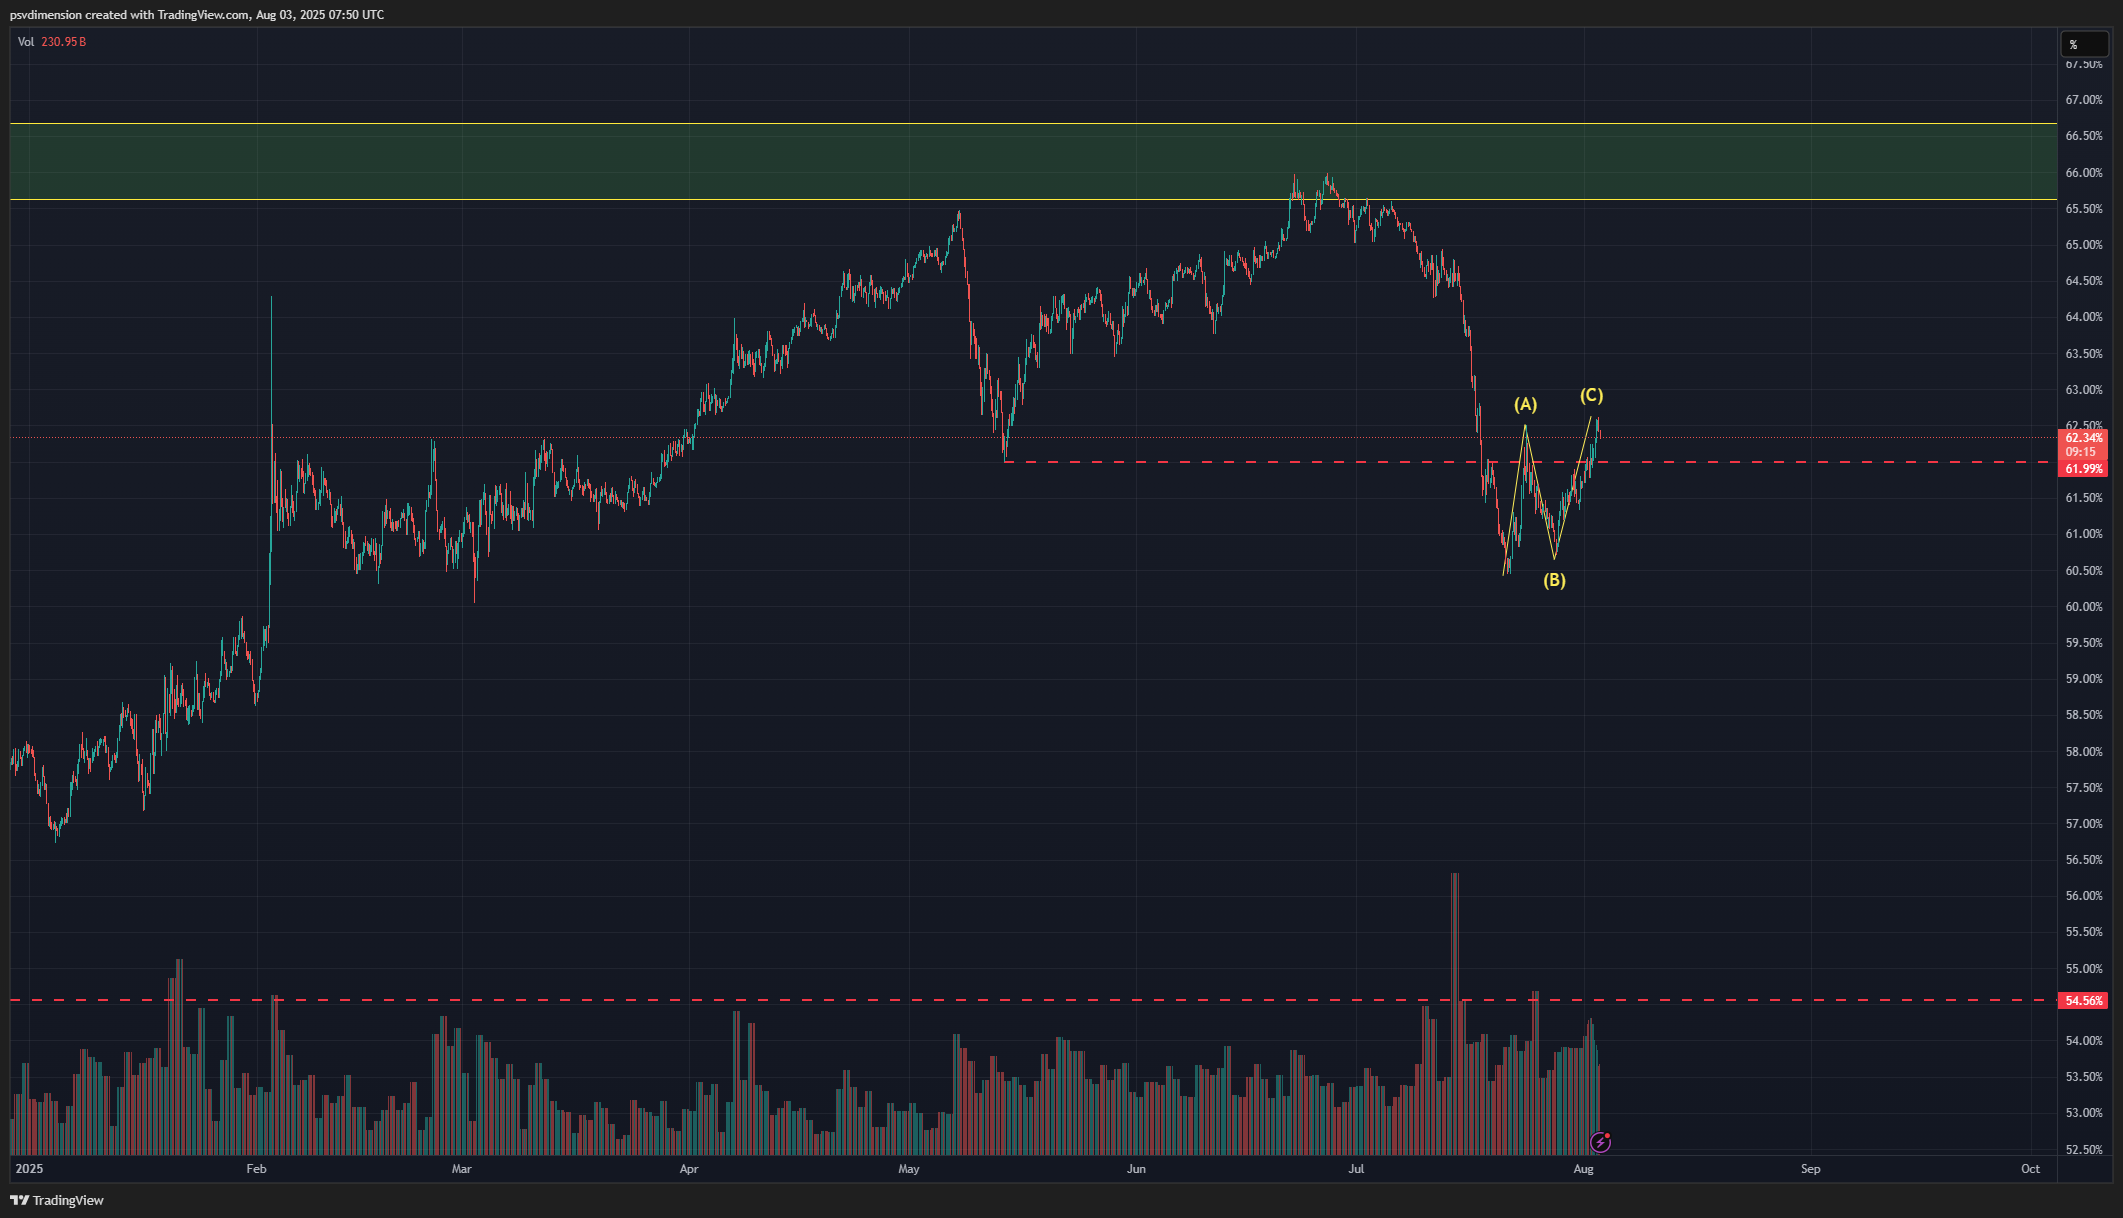
Looking at the recent price action, we can see that BTC.D experienced a local trend breakdown at the 61.90% level. As is common after such a break, we are now seeing a corrective bounce upward, beautifully forming a classic ABC corrective wave. The crucial question now is: is this just a temporary correction before dominance continues to fall (giving altcoins more room to breathe), or is it a consolidation before BTC regains strength and continues to climb?


Chart showing the recent ABC correction on the Bitcoin Dominance chart after breaking the 61.90% level.

It’s important to remember that a small dip in BTC.D doesn’t automatically mean a full-blown altseason. Often, it just provides a short “relief rally” for alts before Bitcoin continues its climb.

The Bigger Picture: The One Level That Truly Matters for Altseason

While the short-term movements are interesting for traders, the long-term picture provides much more clarity. Globally, one of the most important support levels for Bitcoin Dominance is at 54.50%. A decisive break below this level is what could truly signal that a major, sustained altseason is upon us. Until that happens, any drops in dominance can be considered larger relief rallies.


Long-term chart of Bitcoin Dominance showing the critical 54.50% support level for a true altseason.

The Strategic Answer: Trading the Uncertainty

So, we are left with uncertainty. Will dominance fall, sending alts flying? Or will it rise again, putting pressure on altcoin valuations? If you don’t want to worry about this, if you’re tired of guessing and want psychological freedom, you need to think about a strategy that works regardless.

This is where a systematic approach like Grid Trading becomes invaluable. Instead of trying to predict the outcome of the BTC.D chart, you can set up a grid bot on a solid asset you believe in long-term. A bot like ATHgrid doesn’t care if it’s altseason or not. It trades the volatility, accumulating small, consistent profits from the price swings that happen every day, week, and month. It’s a plan that works while you wait for the market to reveal its hand.

While everyone else is stressed, watching the dominance chart and hoping for a specific outcome, your system is simply working, building your portfolio one trade at a time.

Crypto Mining vs. Grid Trading: How I Turned My Bot into a USDC Miner

Crypto Mining vs. Grid Trading

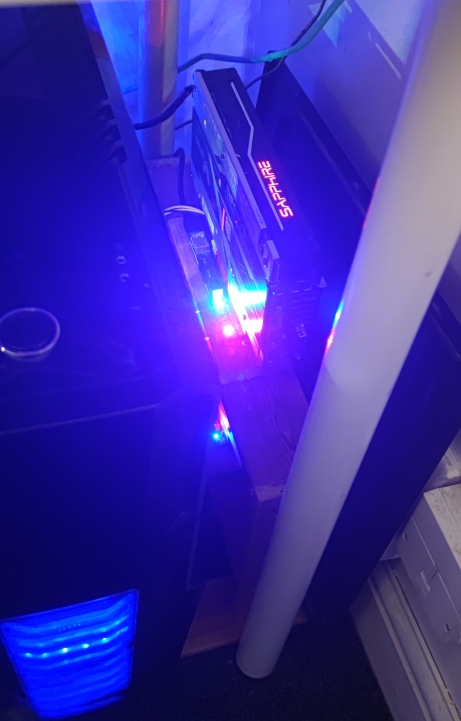
My journey into the world of crypto began not with a trade, but with the distinct hum of a GPU fan. I still remember the excitement of assembling my first amateur rig, carefully optimized to mine Ethereum. It was a modest setup, but it worked, steadily adding ETH to my wallet. It felt like magic.


My first amateur Ethereum mining rig setup

The Day the Mining Died: When ETH Moved to Proof-of-Stake

Unfortunately, that era came to an abrupt end. When Ethereum transitioned from Proof-of-Work (PoW) to Proof-of-Stake (PoS), GPU mining profitability plummeted overnight.

Mining other coins wasn’t a viable alternative; their value was too low to cover the soaring electricity costs. The constant need for expensive hardware upgrades was another nail in the coffin. My physical mining operation was over, and I had to find a new way to stay active in the market.

That’s when my journey into trading began, which eventually led me to discover the power of Grid Trading.

The “Aha!” Moment: Grid Trading is the New Mining

After analyzing the mechanics, I had a revelation. What if we could think of a Grid Trading strategy as a new, more efficient form of mining? A “digital mining rig” that doesn’t mine volatile coins, but stablecoins like USDC.

The analogy is surprisingly perfect:

  • The “Hardware Cost” is Your Trading Deposit: The initial capital you allocate to a grid strategy is your one-time “investment in the rig.” This is the principal that will work for you.
  • The “Mined Tokens” are Your Take Profits: By setting your bot to not reinvest profits, every successful “take profit” trade is like a newly mined coin. It’s a steady stream of realized gains sent directly to your account.
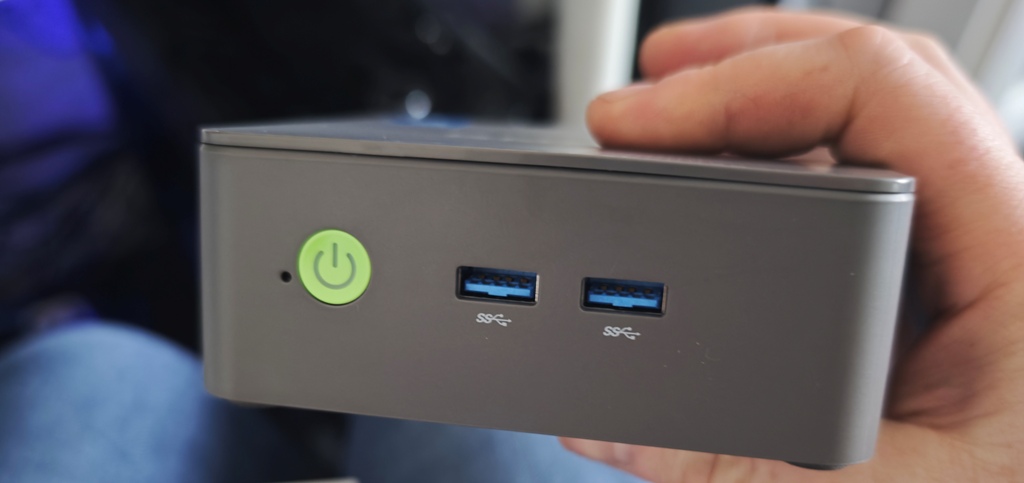
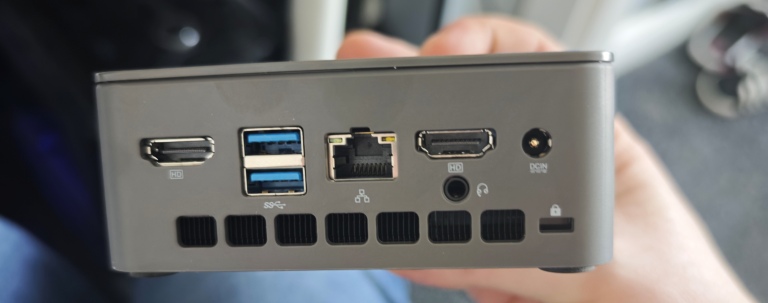
  • The “Electricity Bill” is Almost Zero: My old GPU rig consumed hundreds of watts. My ATHgrid bot runs on a Mini PC that uses just 15W of power. The cost is negligible.

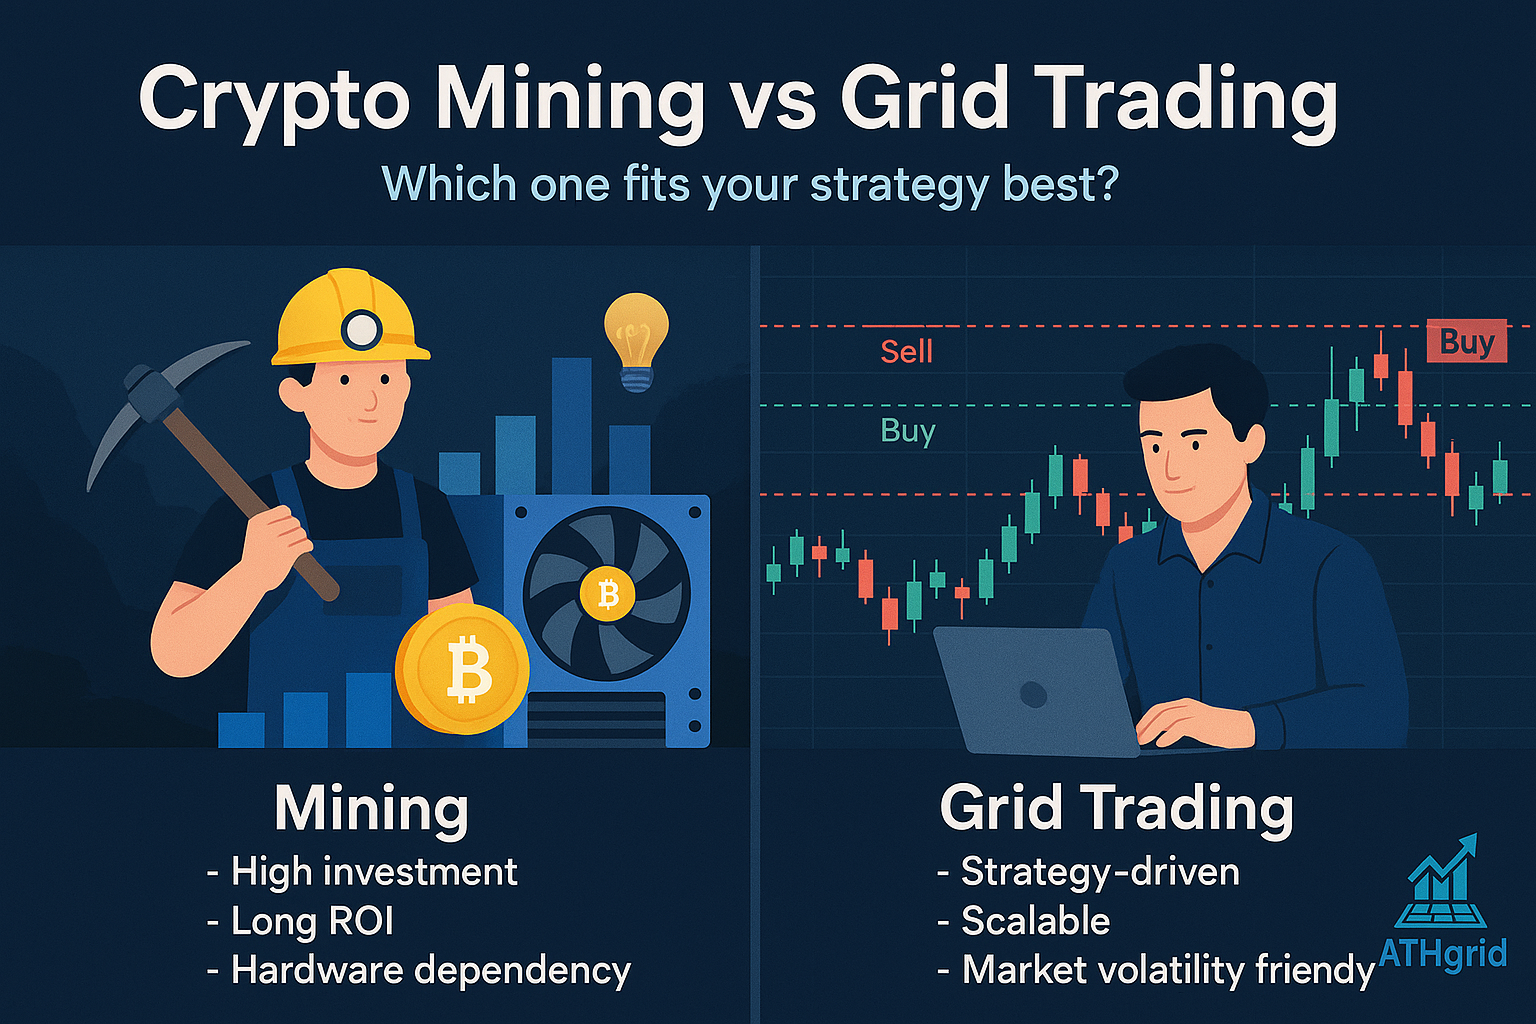
Infographic comparing Crypto Mining vs Grid Trading

What Should Your “Digital Rig” Mine? Why Bitcoin is the Safest Bet

So, if our bot is a miner, what asset should it “mine”? For a long-term, wide-grid strategy, Bitcoin (BTC) is arguably the safest and most reliable choice. As its market capitalization grows and institutions like ETFs enter the space, its wild, multi-year price swings may begin to flatten. This doesn’t mean volatility is gone; it means the price is more likely to trade within a large, defined range for longer periods – a perfect scenario for a grid bot.

Imagine setting a wide grid for BTC, say from $50,000 to $1,000,000. While others are waiting for the next 10x move, your “digital rig” is working 24/7, mining USDC from every price fluctuation within that massive range.

Grid Trading vs. Mining: The Verdict

Let’s compare the two directly. Traditional mining is vulnerable to hardware failures, increasing difficulty, and high energy costs. Grid Trading, on the other hand, is a software-based strategy. What about market corrections? While a mining rig’s value plummets in a bear market, your grid trading deposit simply continues to work, buying low and waiting for the eventual bounce to sell high. Your capital is always active.

My entire mining operation has now been replaced by a quiet, low-power Mini PC. It doesn’t generate heat, it doesn’t make noise, but it diligently “mines” tokens for me every single day.

Is it the same thrill as building a physical rig? Maybe not. But is it a more sustainable, adaptable, and powerful way to generate passive income from the crypto market in 2025 and beyond? Absolutely.

The Ultimate Guide to Grid Trading: A Strategy for Any Market Condition

Grid Trading for beginners


Diversification, Plan, and Grid Trading

Is Diversification Everything? What If the Market Has Other Plans?

Many investors in the cryptocurrency market believe in the mantra of diversification. We spread our capital across many promising projects, which is, of course, a correct risk management practice. But what if the altseason everyone is waiting for never comes? What if the market pulls back again and enters an accumulation phase for the next 2-3 years? Do you have a plan for that?

Or maybe altseason will arrive, but it will only be a momentary, euphoric spike, after which, as always, a long night and silence in the market will follow? What then? What’s your plan…?

There is one answer: Grid Trading. A strategy that allows you to earn where most people cry – during periods of volatility and sideways trends. With carefully selected assets and a system like ATHgrid, you can turn market uncertainty into your advantage.

History Likes to Rhyme: A Lesson from the ETCUSDT Chart

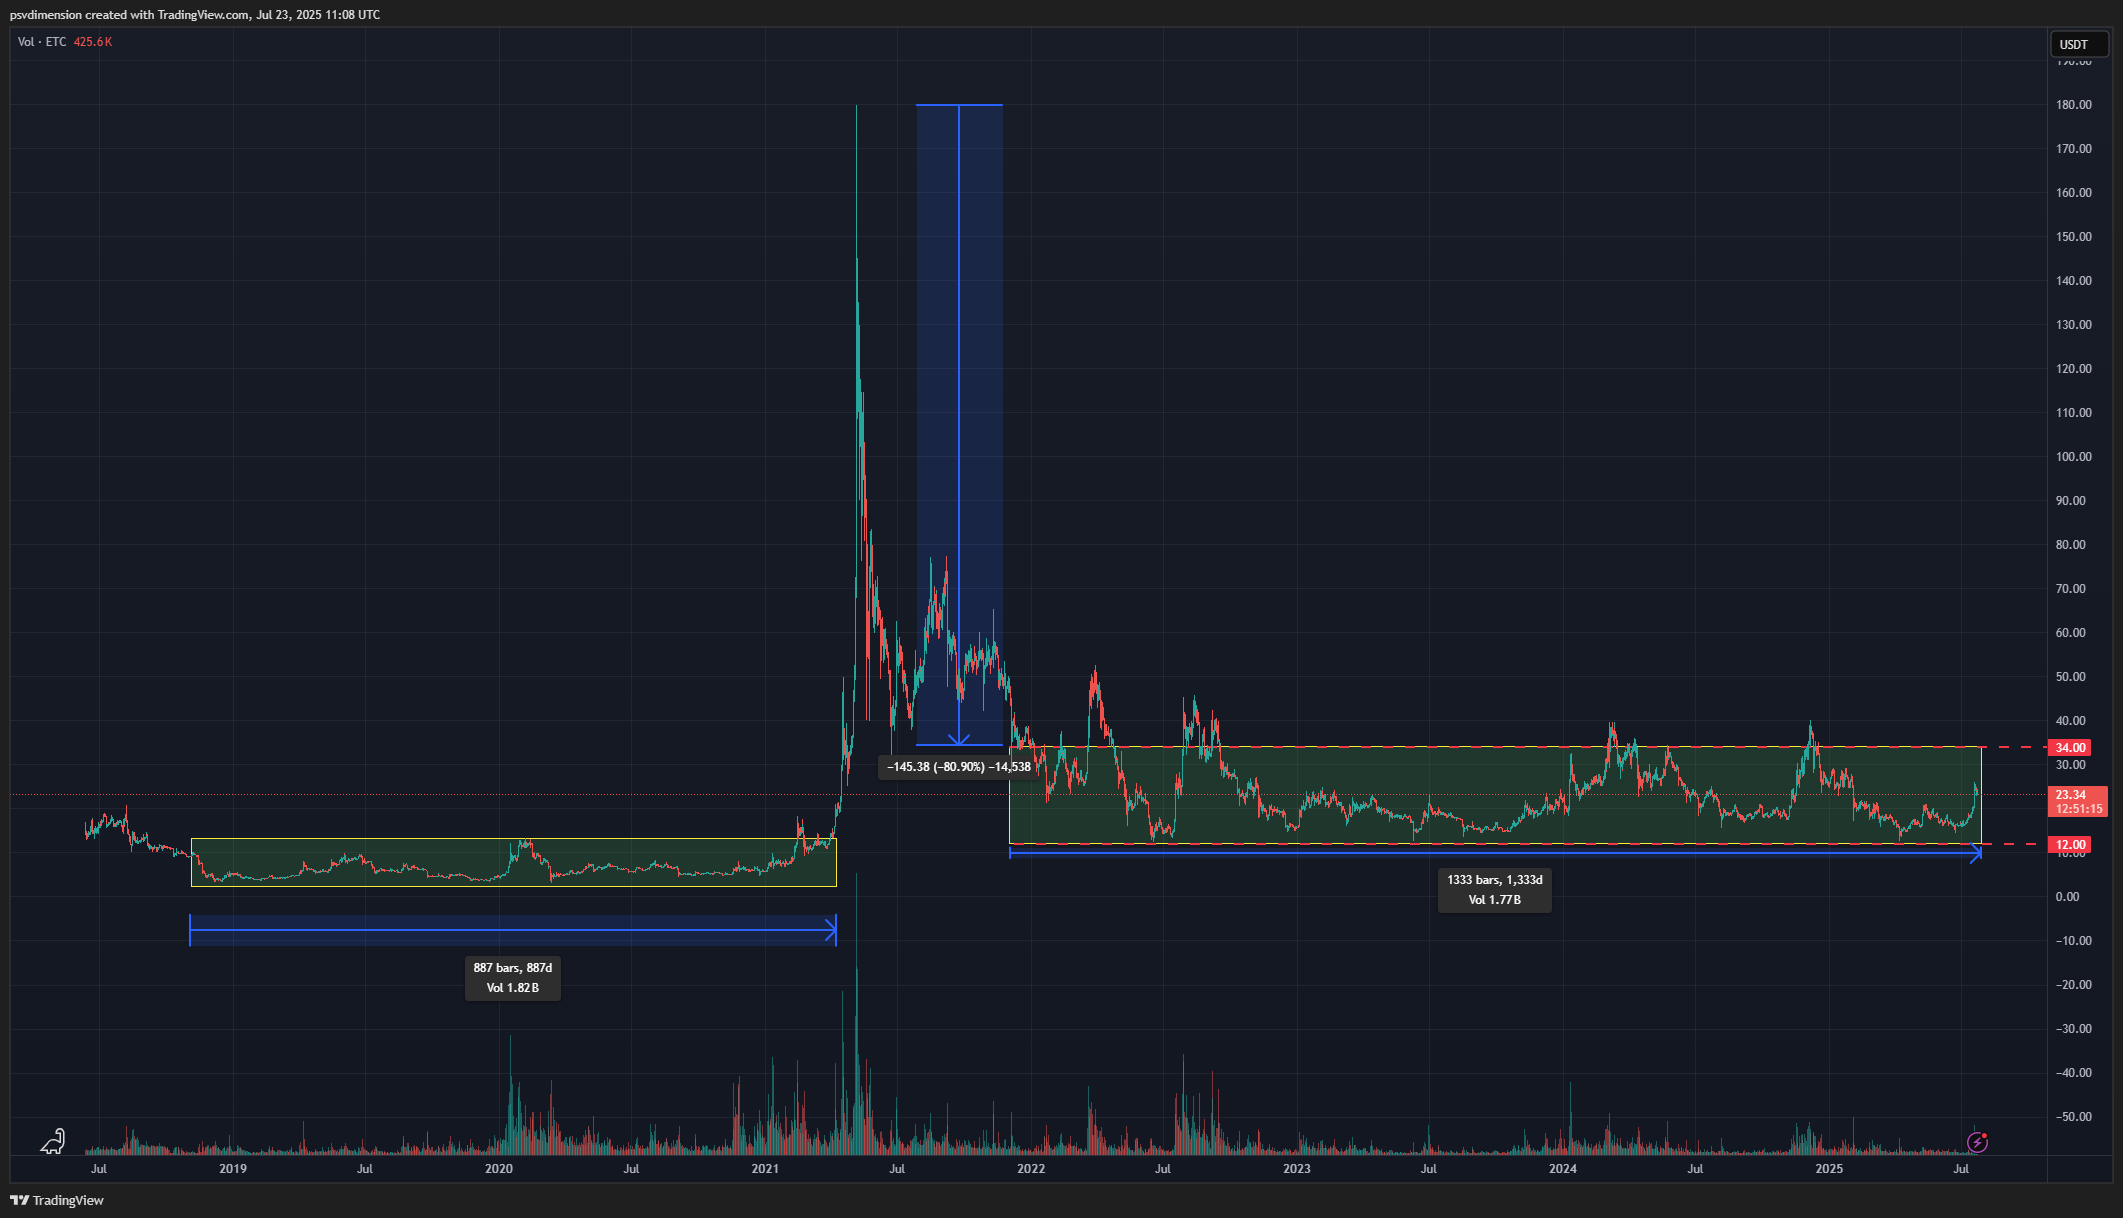
Let’s look at our case study – the ETCUSDT pair. An analysis of the historical chart teaches us patience. After the 2018 bull market highs, Ethereum Classic entered a period of bear market and accumulation that lasted a full 887 days! After such a long period of “silence,” a powerful upward shot occurred.

And what’s next? The market began to consolidate again. It is in these long, seemingly “boring” periods that the real fun for the grid strategy begins.


Historical chart of ETCUSDT showing a long bear market

Planning the Grid: A Strategy for Survival and Profit

The safest and most effective approach is to set up the grid for the long term. We start by identifying solid, established projects that have already survived at least one bear market. We wait until the price of a given asset drops by about -80% from its all-time high (ATH). It is in this zone of “fear” and “panic” that we begin to build our position.

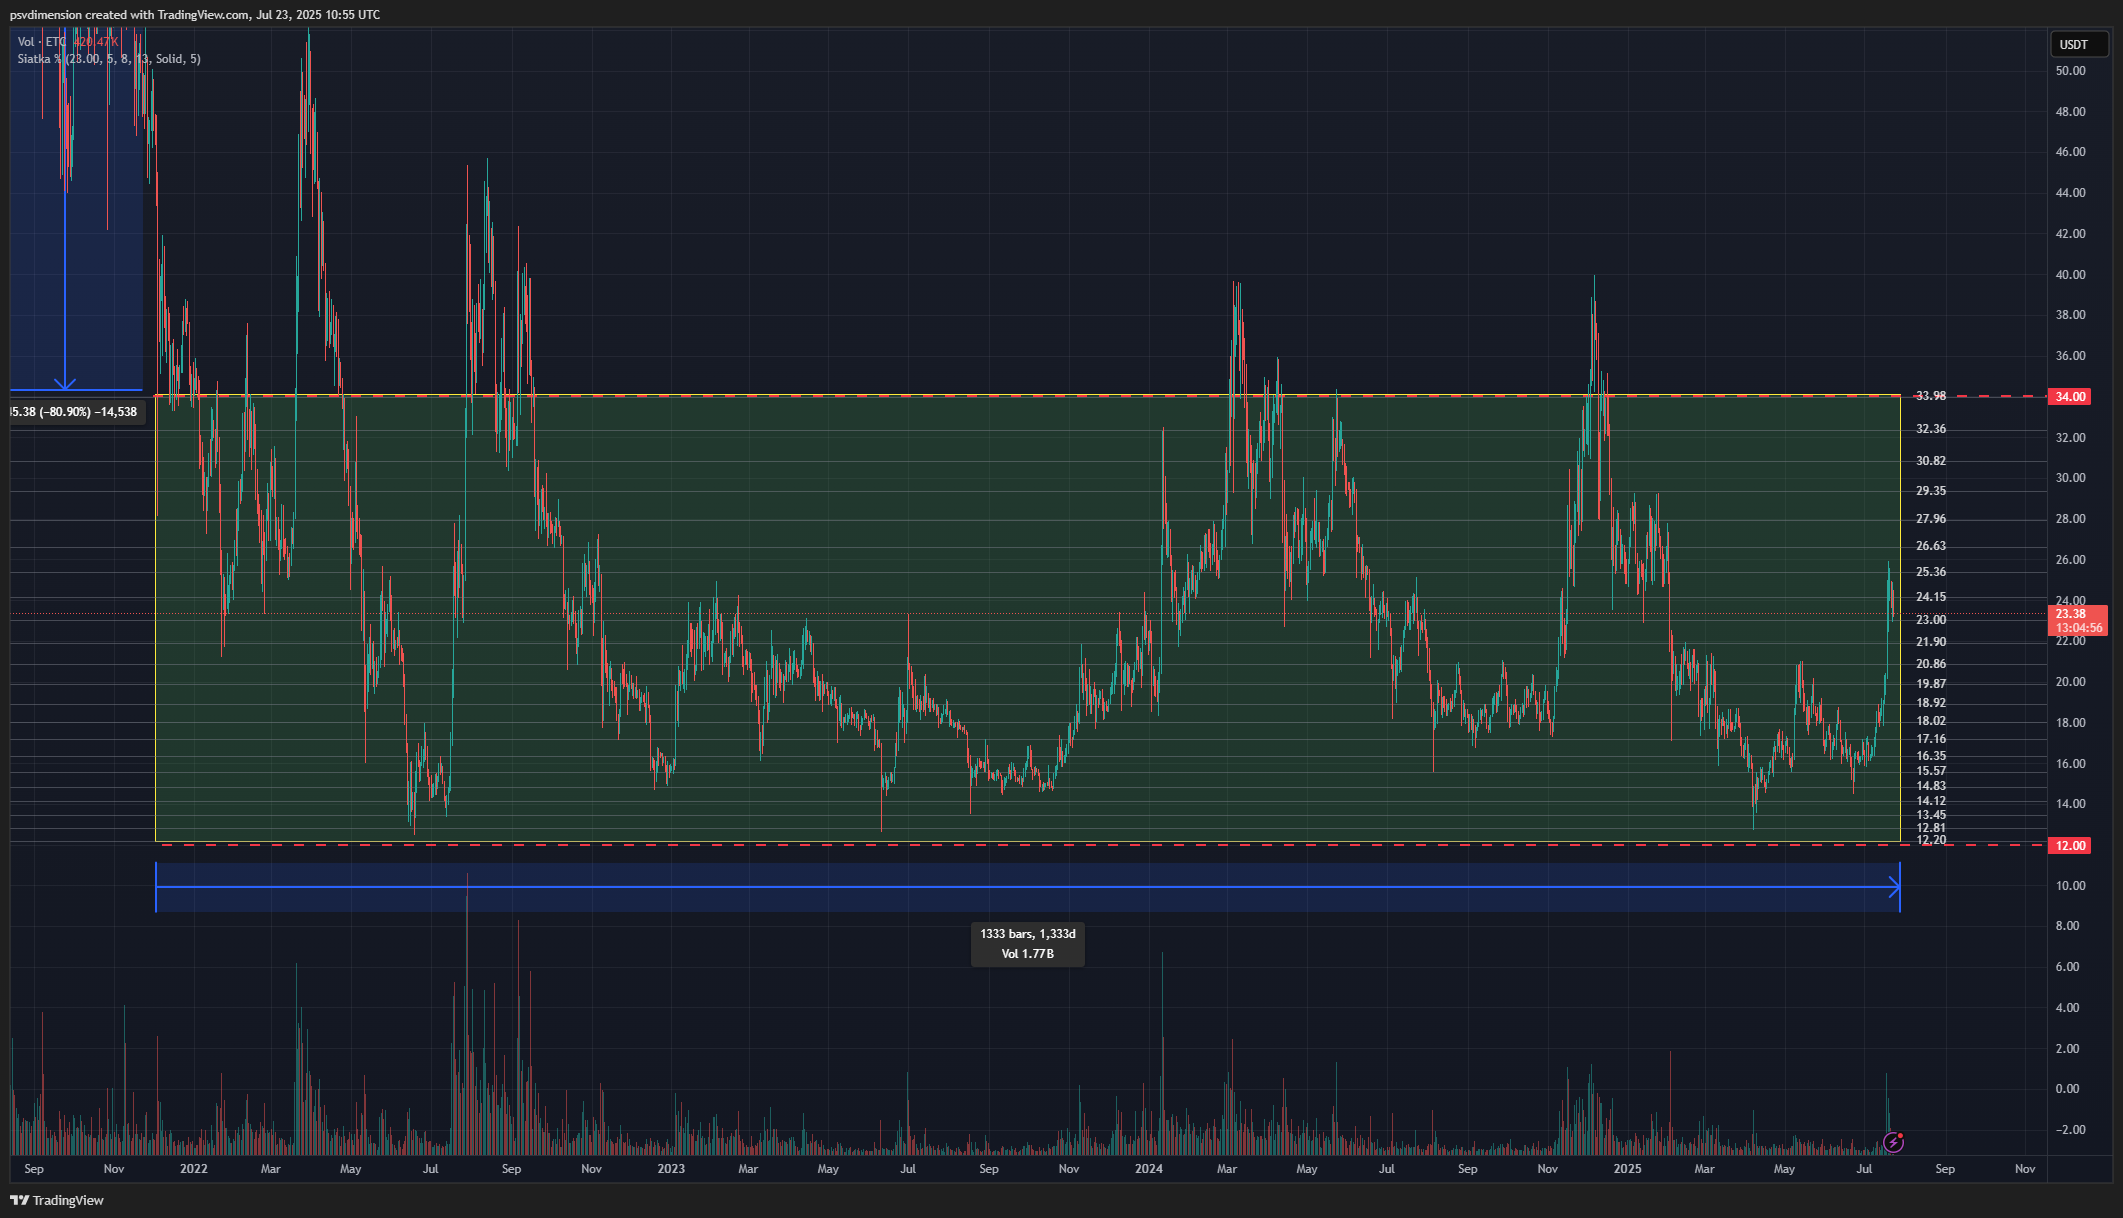
For our ETCUSDT example, whose peak was ~$176, an 80% drop gives us a price around $35. Our plan involves setting up a grid in the range of $12 to $34. Why this range? The lower bound ($12) is near the bottom of the previous bear market, and the upper bound ($34) is a significant resistance level that has been tested multiple times. We will set up the grid with levels every 5%.

(If you need a helper script for TradingView that assists in visualizing and deploying grids, contact us).


ETCUSDT chart with a grid overlay from $12 to $34

How Does the Grid Trading Bot Work? Discipline and Automation

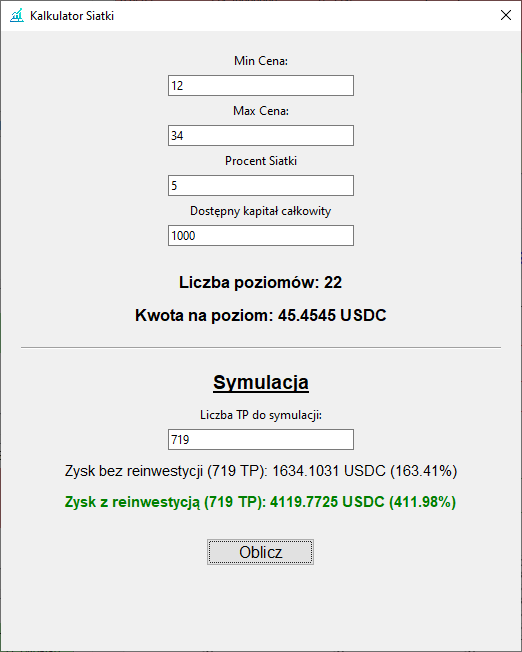
Let’s assume we allocate $1000 to this strategy. How does our bot manage this capital? Let’s use our “Grid Calculator” tool.


ATHgrid Grid Calculator

After entering the data (range $12-$34, levels every 5%, capital $1000), the calculator determines that we have 22 levels in the grid, and we should allocate $45.45 per level. This is the key to success – we must have enough capital to cover all buy orders within our range. Discipline is fundamental.

When we start the bot at a price of, for example, $18, it begins to operate, placing several buy orders below and several buy orders above the current price. But why does it buy up? This is a unique feature of the “long” strategy, which allows earning even if the price only rises from the moment the bot is started. When the price reaches a level of, say, $18.90, the bot buys this position and immediately sets a sell order 5% higher, at ~$19.85. When the price gets there, the position is sold at a profit, and the bot immediately places another buy order at the same level, while also activating a new buy order at the next, higher grid level.

And what happens when the trend reverses? The bot, which always maintains 5-6 active orders around the price, begins to buy back cheaper the same levels it previously sold higher. During high volatility, the bot can execute several such trades in a single day on the very same price levels!

What If the Price Leaves the Grid? Patience Over Panic.

Our strategy does not use stop-losses. If the price falls below $12 or rises above $34, the bot simply stops trading and patiently waits for the price to return to the grid. This protects us from sudden moves, so-called “springs,” which often “wash out” traders from the market who use tight stop-losses. The bot simply gets back to work when the conditions are favorable again.

Of course, if the price falls after starting the bot, the initially opened positions will be at a loss. This is natural. It is precisely here that patience and discipline are key, which over time will bring the desired profits when the trend reverses.

The Results Speak for Themselves: Backtesting and Simulation

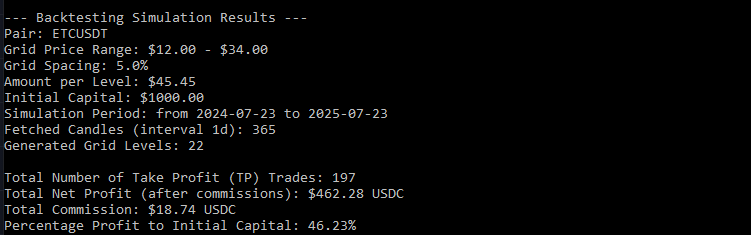
We conducted a backtest for the ETCUSDT pair on Binance for the last year (the maximum period available on the exchange). During this time, the bot executed 197 Take Profit trades.


Backtesting results for ETCUSDT

Extrapolating these results over the entire bear market period for ETC (1333 days since the end of 2021), our simulation shows that the bot could have executed as many as 719 Take Profit trades. And here is where the magic begins:

  • Without reinvesting profits: We achieve a ~163% return on capital. This is a safer option, where profits are regularly set aside.
  • With reinvesting profits: The magic of compounding comes into play. The profits from each trade are added to the capital for that level, increasing future profits. In this scenario, the simulated return is a staggering ~412%!

Simulation of profits with and without reinvestment

There is one condition: to realize the full potential, we must patiently wait for the price to reach the upper boundary of the grid. The advantage of our bot is that by maintaining only 5-6 orders at a time, it does not lock up all the capital, allowing more advanced traders to flexibly manage their funds and maximize profits.

Grid Trading is not a get-rich-quick scheme. It’s a marathon, not a sprint. It is a method for the patient and disciplined, allowing you to build capital systematically and thoughtfully, regardless of whether euphoria or fear prevails in the market.

Ready to put these strategies into action without being glued to a screen? Download ATHgrid today and start automating your trading on Binance!

Will BTC Cycle History Repeat? Logarithmic Analysis Points to a $175,000 Target

BTC Cycle Analysis


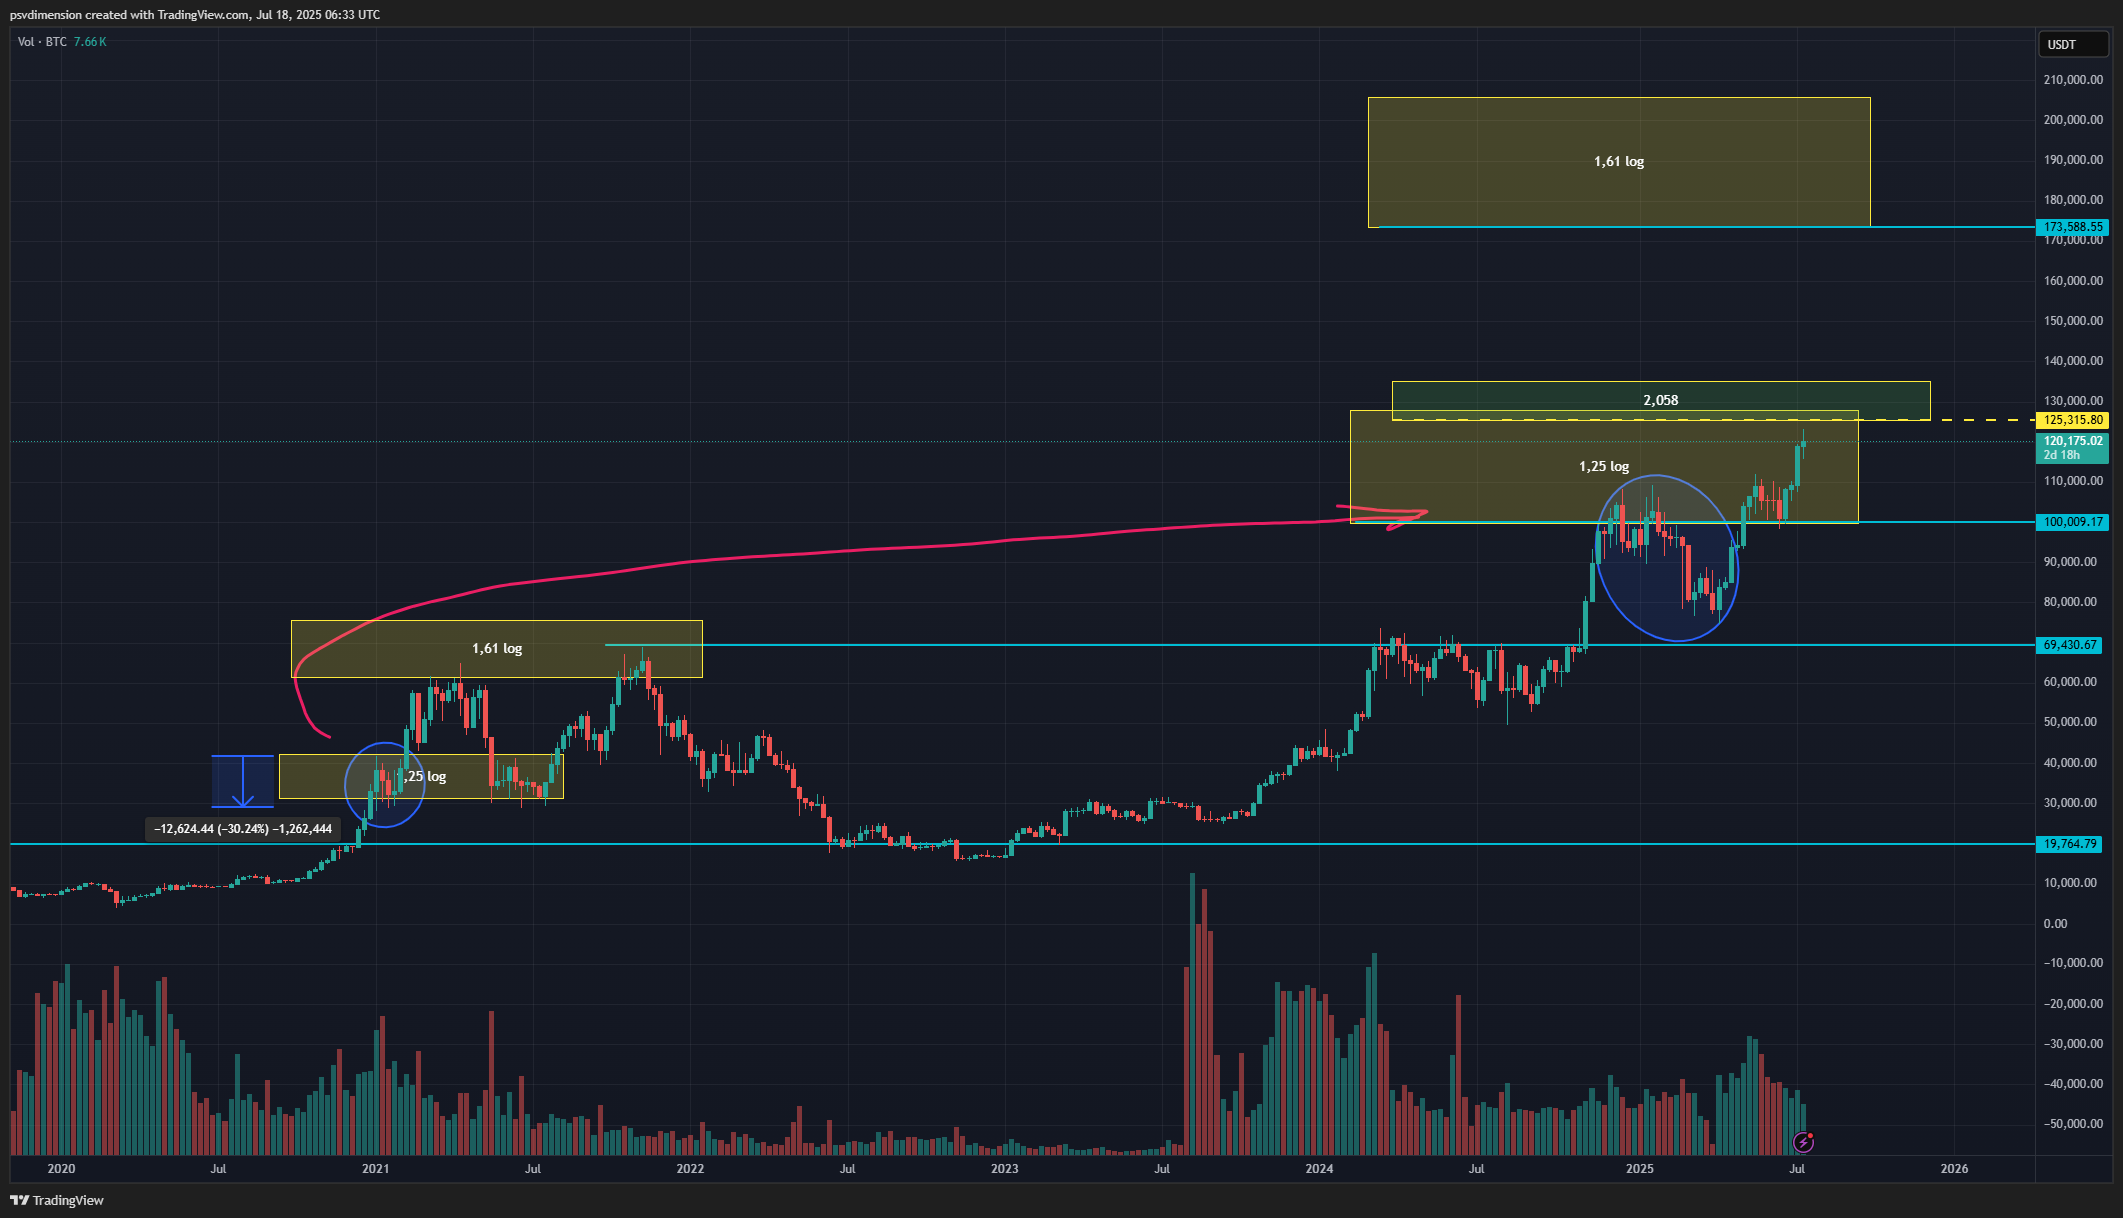
Chart of BTC cycle analysis pointing to a $175,000 target

The cryptocurrency market, particularly Bitcoin, has fascinated traders for years with its cyclical nature. Although history never repeats itself exactly, it often rhymes, leaving patterns on the charts that can help navigate future price movements. By analyzing the current bull cycle on a logarithmic scale and comparing it to the previous one from 2020-2021, we uncover striking similarities that may point to a potential peak for this bull run around the $175,000 mark.

Echoes of the Past: The 2021 Bull Run and BTC Cycle

Let’s look at the chart on TradingView.

In the previous cycle, after a dynamic surge, Bitcoin caught its breath and entered a consolidation phase. A key pause occurred at the 1.25 logarithmic Fibonacci extension level. This was a period where the market tested investors’ patience before making its final push upward. The peak of the bull run and the end of the cycle occurred at the next key level – 1.61 log. After reaching this target, a long bear market began.

The Current Cycle: Are We Playing the Same Script?

Let’s shift to the present. As seen in the blue circle on the chart, we have witnessed nearly identical behavior this year. The price of Bitcoin, after an impressive rally, has once again paused and consolidated around the 1.25 log level. This similarity is too clear to ignore and forms the basis of our further analysis.

What’s Next? Two Key Levels on the Horizon

If history is to repeat itself, we have two crucial stops ahead:

1. The Supply Zone (~$128,000): Before we think about the peak, BTC must overcome a significant resistance zone. On our chart, this is marked by the 2.058 Fibo level, corresponding to a price of approximately $128,000. This is an area where sellers have historically been strong, so breaking through this level will be a key confirmation of the bulls’ strength.

2. The Potential Cycle Top (~$175,000): If the resistance at $128k is broken, the next logical target, according to the historical pattern, is the 1.61 log level. In the current cycle, this falls at a price of approximately $175,000. This is the level that could represent the potential peak of the current bull run, after which the market may enter a longer correction phase.

How to Use This Knowledge? The Role of Automation in Consolidation

Many traders, seeing such analyses, wait for “that one big move.” However, the real art is to also make money during periods of waiting. Long consolidation phases, like the one we witnessed at the 1.25 log level, are the perfect environment for grid trading strategies. If you’re new to this concept, you can learn the fundamentals in our Ultimate Guide to Grid Trading.

Bots like ATHgrid are designed precisely to systematically accumulate small profits from “boring” sideways price fluctuations. Instead of passively waiting for a breakout, a bot can actively work, generating profits that, over the scale of months, become a significant addition to a portfolio.

Conclusion

Technical analysis based on historical cycles is a powerful tool, but it never offers 100% certainty. The key levels to watch are the resistance at ~$128,000 and the potential target at ~$175,000. Understanding these zones allows for better strategy planning, regardless of whether the market follows this exact path.

A systematic approach, like grid trading, can help you capitalize on the volatility around these key price zones without relying on emotional guesswork.

(Remember, this article is not investment advice. Always conduct your own analysis.)

Ready to put these strategies into action without being glued to a screen? Download ATHgrid today and start automating your trading on Binance!