Crypto Volatility: How to Measure and Use a Trader’s Best Friend

Market Volatility: A Trader’s Best Friend. How to Measure and Use It?
Ask any novice trader what they fear most in the market, and you’ll likely hear one word: volatility. Violent price swings, unpredictable moves, chaos – it’s all terrifying. But what if I told you that for a conscious investor, especially a Grid Trading bot user, volatility isn’t the enemy? It’s the best friend. It’s the fuel that powers the profit-generating machine.
What Exactly is Market Volatility?
In the simplest terms, volatility is a measure of how much and how quickly the price of a given asset changes over time. High volatility means large and rapid fluctuations in both directions. Low volatility means periods of calm where the price moves within a narrow range. Directional traders hate volatility without a clear trend. Grid traders live for it.
How to Measure Market Volatility? (A Trader’s Weather Forecast)
You don’t have to guess volatility – you can measure it. Think of it as a weather forecast for the market. Two simple tools available on any charting platform like TradingView will help you assess it:
1. Bollinger Bands: This is one of the most popular indicators. You don’t need to understand the complex formulas. Just remember one rule: the width of the bands shows the volatility. When the bands expand, volatility increases. When they contract, the market is entering a period of calm. You can learn more about Bollinger Bands here.
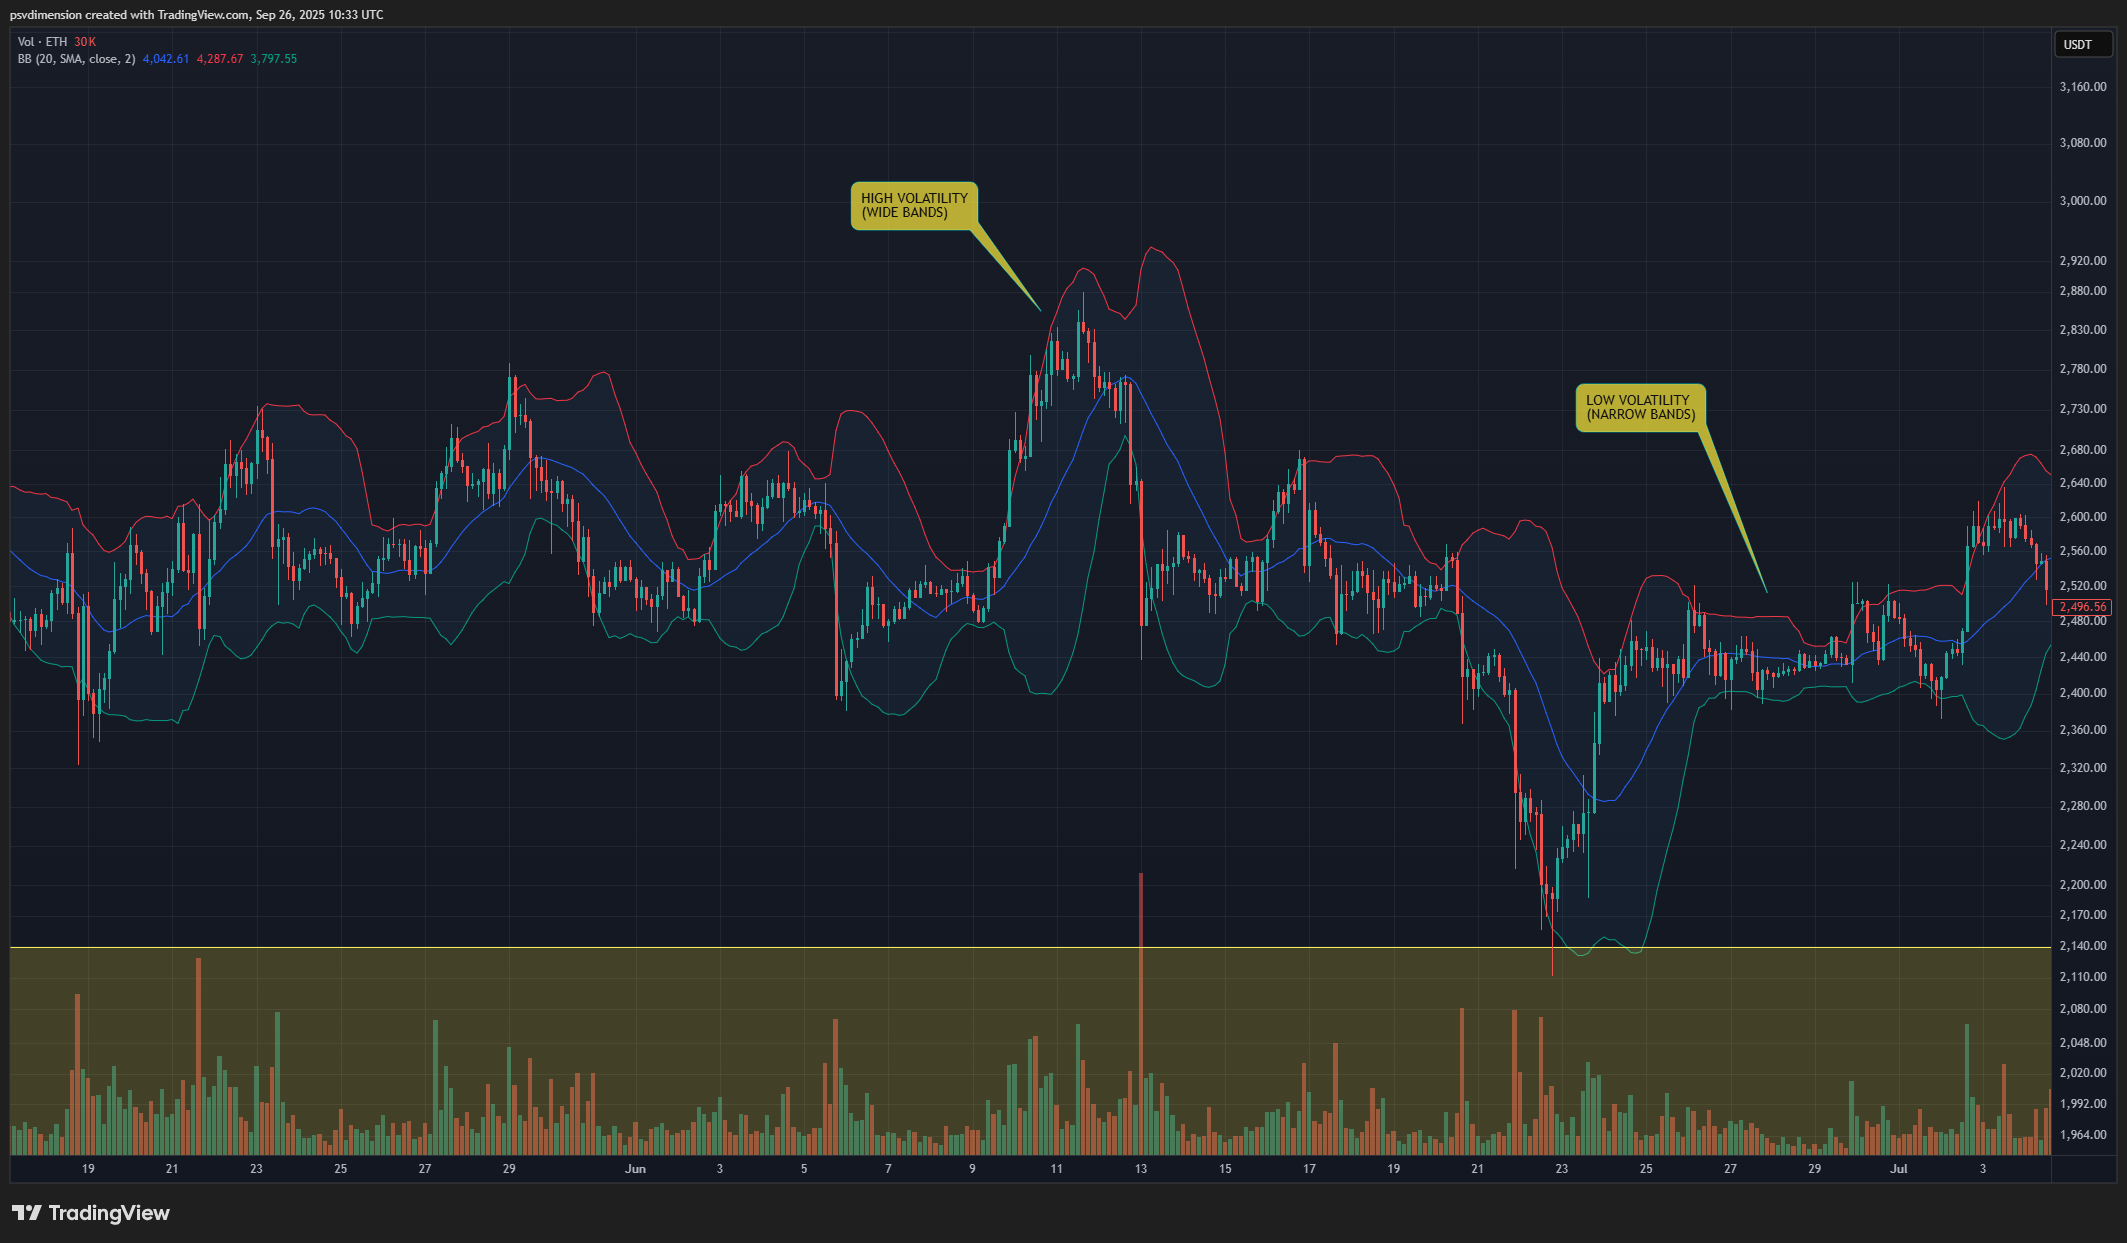
Wide bands = high volatility. Narrow bands = low volatility.
2. ATR (Average True Range): This is an indicator that shows the average range of price movement over a given period. A high ATR value means the candles are large and volatility is high. A low ATR value indicates a “boring” market.
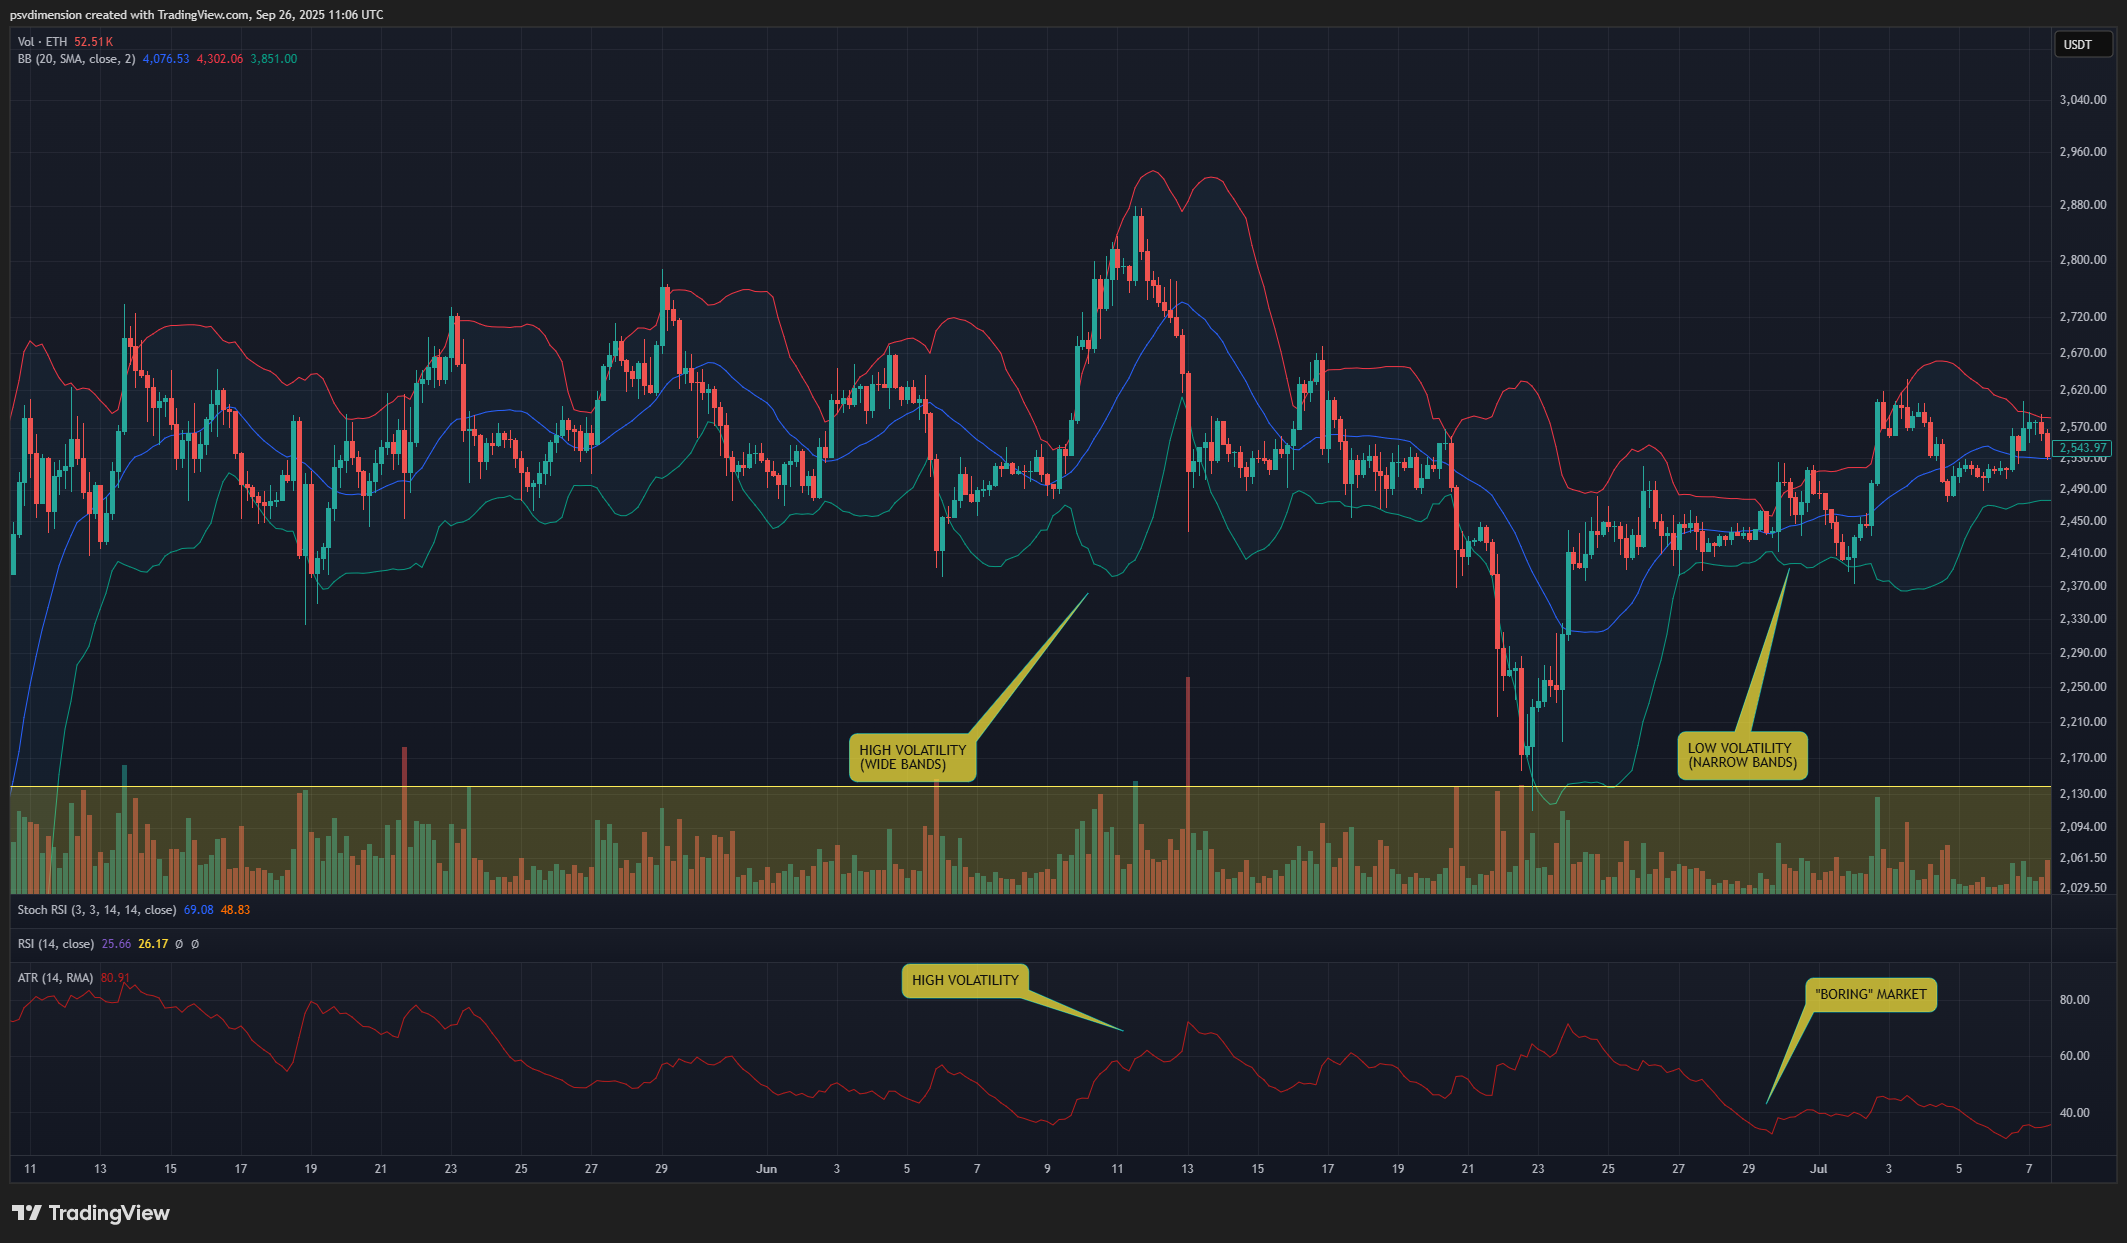
High ATR – Volatility is high. A low ATR – “boring” market.
How to Turn Volatility into Profit with ATHgrid?
With knowledge of the current volatility, you can perfectly adjust your bot’s strategy in ATHgrid:
- When volatility is HIGH (wide Bollinger Bands, high ATR): Set a wider grid range with fewer levels. This will allow you to catch the larger price swings. This is also the perfect time to use the new “Skip-Level” feature in ATHgrid 1.2 to maximize profit from each strong impulse.
- When volatility is LOW (narrow Bollinger Bands, low ATR): Set a narrower grid range with more levels (a denser grid). This allows the bot to “farm” even the smallest, most frequent price moves, generating a steady stream of small profits.
Summary: Market Volatility is Your Fuel
Stop seeing volatility as a threat. Start treating it as the free energy that drives the market. Your only job is to have a tool that can efficiently convert that energy into real profits. ATHgrid was created for this very purpose.

Ready to befriend volatility? Download ATHgrid and start turning market chaos into your greatest asset.
Leave a Reply